Indicators: Volume
What is it?
Volume is a very simple indicator but also a very powerful one if used correctly. It is a measure of how many shares of contracts of any given financial asset has been trader in a given period of time.How is it calculated?
Volume is just a count for al the shares that were traded that day. If a buyer of a stock purchases 100 shares from a seller, then the volume for that period increases by 100 shares based on that transaction.How to use it?
Volume is usually seen as an histogram at the bottom of a price chart. Each bar represents the volume of each period.Volume is used to measure the worth of a market move. If the markets have made strong price move either up or down the perceived strength of that move depends on the volume for that period. The higher the volume during that price move the more significant the move.
Volume in Trends
In a rising market volume should be also increasing. This means that the market is finding new buyers to sustain the trend. Increasing price and decreasing volume show lack of interest and this is a warning of a potential reversal.

This can be hard to wrap your mind around, but the simple fact is that a price drop (or rise) on little volume is not a strong signal. A price drop (or rise) on large volume is a stronger signal that something in the stock has fundamentally changed.
Exhaustion Moves and Volume
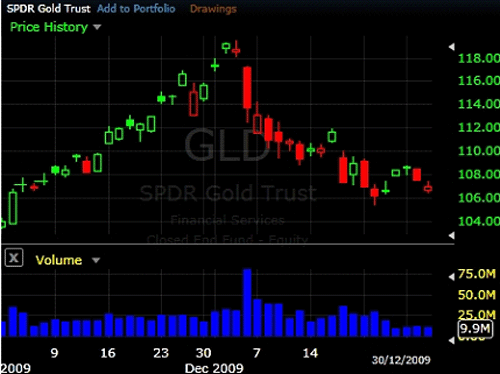
In a rising or falling market we can see exhaustion moves. These are generally sharp moves in price combined with also a sharp increase in volume. Exhaustion moves usually signal the potencial end of a trend.

Participants who waited and are afraid of missing more of the move pile in at market tops, exhausting the number of buyers. At a market bottom, falling prices eventually force out large numbers of traders, resulting in volatility and increased volume.
Volume and Price Reversals
After a long price move higher or lower, if price begins to range with little price movement and heavy volume, often it indicates a reversal.
Volume and Breakouts Vs. False Breakouts
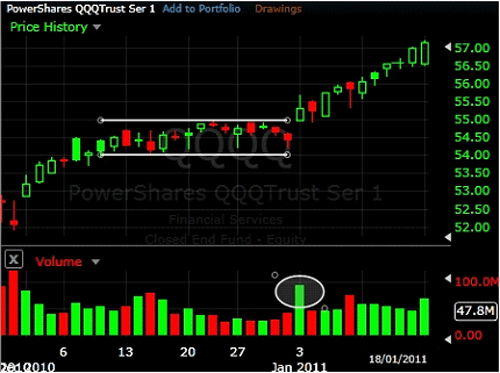
On the initial breakout from a range or other chart pattern, a rise in volume indicates strength in the move. Little change in volume or declining volume on a breakout indicates lack of interest and a higher probability for a false breakout.

Volume Indicators
There are many volume-based indicators that add other perpectives about how to interpret volume. I'll cover those in further posts.


0 comentarios