Alternative Candles: Heikin Ashi
Candlesticks are a great method to plot a chart, but there's another way to plot those candles.
It is called the Heikin Ashi Technique. This charting method uses the same principles of traditional candlesticks, but it changes the open,high,low and closing values of the candlestick.
New Values:
Close = (Open+High+Low+Close)/4 = Average price of the current barOpen = [Open (previous bar) + Close (previous bar)]/2 = Midpoint of the previous bar
High = Max (High,Open,Close) = Highest value in the set
Low = Min (Low,Open, Close) = Lowest value in the set
Heikin Ashi means "Average Bar" in Japanese. But what's the point of using a candlestick that has averaged values? Well most profits (and losses) are generated when markets are trending, so predicting trends correctly can be extremely helpful. The Heikin-Ashi techniqueis one of many techniques that, used in conjunction with candlestick charts, can improve the isolation of trends and to predict future prices.
Constructing the Chart
The Heikin-Ashi chart is constructed like a regular candlestick chart (except with the new values above). The time series is defined by the user--depending on the type of chart desired (daily, hourly, etc.). The down days are represented by filled bars, while the up days are represented by empty bars. Finally, all of the same candlestick patterns apply.Patterns
Just as with traditional candlesticks, each candle tells a story. With Hikin Ashi charts, the patterns can be reduced to three:- Hollow candles with no lower "shadows" indicate a strong uptrend: let your profits ride!
- Hollow candles signify an uptrend: you might want to add to your long position, and exit short positions.
- One candle with a small body surrounded by upper and lower shadows indicates a trend change: risk-loving traders might buy or sell here, while others will wait for confirmation before going short or long.
- Filled candles indicate a downtrend: you might want to add to your short position, and exit long positions.
- Filled candles with no higher shadows identify a strong downtrend: stay short until there's a change in trend.
How does a Heikin Ashi chart look like?
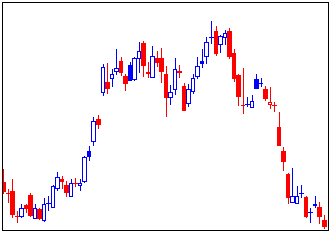
This is a normal candlestick chart:
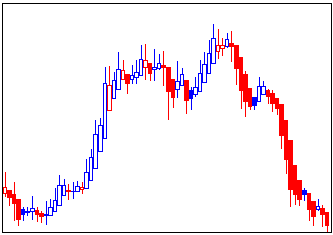
This is a Heikin Ashi chart:
As you can see, the Heikin Ashi chart shows its "easier" to read. You can easily see the strong days and you can clearly spot the trend. This is the strenght of the Heikin Ashi candles, they cut all the market noise and show you the prevailing trend.
But not everything is perfect with these candles, as their opening and closing values are averaged, they are lagging behind the actual price, this means that they should be used more like and indicator than an actual way to read price action.
Despite the lag, which is based on just one period, HA Candles when used along with other technical analysis such as Support/Resistance or even moving averages can present a clearer picture to the trader, as compared to the traditional candlesticks. And in its defense, while it might seem easier to take a signal off the doji or a hammer candle pattern, Heikin Ashi, due to its lagging nature can in fact confirm a trend reversal.
Conclusions
Heikin Ashi, rather than being a "better" way to plot price action, it is best used as an indicator. This indicator is best used on trending markets, like ETFs, Forex, Commodities, and not on choppy charts, like a stock trading in a tight range or during a consolidation.Pros
- Makes reading a chart easier.
- Better detection of trends and trend shifts.
- Beginner friendly.
- Eliminates market noise.
- Very useful on trending markets.
- When combined with other techniques and indicators, becomes a great tool for traders.
Cons
- Lagging in nature.
- Don't show true price action.
- Doesn't show gaps.
- Not very useful on choppy markets.
While Heikin Ashi candlesticks is not the ‘Holy Grail’ of trading, using these candlesticks can offer beginners a great way to observe the markets and perhaps get more meaning out of the price action as compared to using the traditional candlesticks. Every indicator’s edge is usually offset by one or more factors and Heikin Ashi candlesticks are no exception. While giving the trader the edge of eliminating market noise, the HA Candles tend to lag in nature. As always, reading the signals from HA Candlesticks and confirming the same with other technical indicators is always a good practice.
If you want an example of a Heikin Ashi Swing Trading Strategy, check this out: Heikin Ashi Swing Trading


1 comentarios
This article gives the light in which we can observe the reality. This is very nice one and gives indepth information. Thanks for this nice article.Candlestick analysis
ReplyDelete