Indicators: Stochastic Oscillator
What is it?
A stochastic oscillator is a momentum indicator that compares a scurity's closing price to its price range over a given period of time. This oscilator usually has two lines: "%K" that acts as a signal line; the other line is "%D" which is usually a 3-period moving average of %K
How is it calculated?
%K = (Current Close - Lowest Low)/(Highest High - Lowest Low) * 100
%D = 3-day SMA of %K

Lowest Low = lowest low for the look-back period
Highest High = highest high for the look-back period
%K is multiplied by 100 to move the decimal point two places
How to use it?
The theory behind this indicator is that in an upward-trending market,
prices tend to close near their high, and during a downward-trending
market, prices tend to close near their low. Transaction signals occur
when the %K crosses through a three-period moving average called the
"%D".
Just like the RSI, the stochastic oscilator can also be used to identify oversold and overbought market conditions.When the stochastic is above 80, it is considered to be overbought; when it is below 20, it is considered to be oversold.
Variants
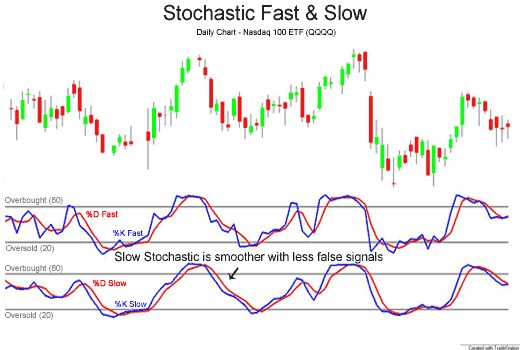
There are 2 main variants of the stochastic oscillator: The Fast & Slow Stochastic.
Fast Stochastic Oscillator: This is the basic formula explained above.
- Fast %K = %K basic calculation
- Fast %D = 3-period SMA of Fast %K
- Slow %K = Fast %K smoothed with 3-period SMA
- Slow %D = 3-period SMA of Slow %K
Comparisons and Contrasts with the RSI
While they are similar and also have similar goals, the way that each of these momentum indicators are calculated makes them better suited for different situations.The RSI takes the last "n" periods and divides the gross positive changes per period by the gross negative changes. This means that the more often prices move higher in that "n" period span and the greater those changes become, the higher the RSI value.
A Stochastic is the measurement of the placement of a current price within a recent trading range. The theory is that as prices rise, closes tend to occur nearer to the high end of their recent range. When prices trend higher and closes begin to sag within the range it signals internal market weakness.
Simply stated, the Relative Strength Index yields the most meaningful results in trending markets while Stochastics work best in flat or choppy markets. The RSI, as mentioned, helps determine when a price has moved too far too fast. This implies a trending market. Stochastics help determine when a price has moved to the top or bottom of a trading range, which implies a non-trending (flat or choppy) market.


0 comentarios