• Home
  • Watchlists
  • Education
    • Technical Analysis
    • Trading Psycology
    • Trading Strategies
  • Book Reviews
  • Services Reviews
    • Tim Sykes
      • Tim Sykes's Millionaire Challenge
      • Penny Stocking Silver
      • Tim Sykes DVDs
    • Jason Bond
    • Bulls on Wallstreet
    • Claytrader

Karma Trades


What is it? 


The Moving Average Convergence Divergence, also known as MACD, is a trend following and momentum indicator that is based on the relationship between two moving averages.

How is it calculated?

It is calculared by substracting the 26 day Exponential Moving Average (EMA) from the 12 day EMA and plotting it, that's the MACD; then another 9 day EMA is plotted and it is called the signal line.


How to use it:

There are three common methods used to interpret the MACD:

Moving Average Convergence Divergence (MACD)
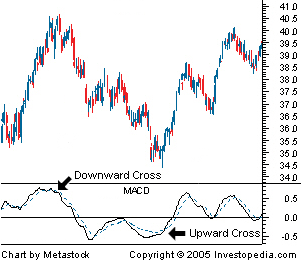
1. Crossovers - As shown in the chart, when the MACD falls below the signal line, it is a bearish signal, which indicates that it may be time to sell. Conversely, when the MACD rises above the signal line, the indicator gives a bullish signal, which suggests that the price of the asset is likely to experience upward momentum. Many traders wait for a confirmed cross above the signal line before entering into a position to avoid getting getting "faked out" or entering into a position too early, as shown by the first arrow.

2. Divergence - When the security price diverges from the MACD. It signals the end of the current trend.

3. Dramatic rise - When the MACD rises dramatically - that is, the shorter moving average pulls away from the longer-term moving average - it is a signal that the security is overbought and will soon return to normal levels.

Variants

The Histogram

Sometimes you will have the option to plot the MACD histogram. This is a series of bars that show the distance between the MACD and the signal line.
http://www.onlinetradingconcepts.com/images/technicalanalysis/MACDbuysellaltNQ.gif


The histogram works as an early indicator for the trend change. When the histrogram's slope changes direction it is signaling a decrease on the trend momentum and then a probable trend change.

Different values

Some people like to change the MACD default values to better suit their trading style. One popular set of values is 13 for the long term EMA, 6 for the short term and 5 for the signal line.

This will make the MACD more responsive to price movements and it's useful when trading shorter timeframes.
Share
Tweet
Pin
Share
No comentarios
What happened is that I opened a Suretrader Account and tried out daytrading.

The result?

Well, lets say that daytrading is not for me at the moment and I'm switching back to Swing Trading.
Finding out what trading style is best for you is one of the most important steps to building a successful trading career. Finding out that Daytrading is probably not for me was a costly but important lesson. You can clearly see all this in my profitly profit chart.

I'm definetly not proud about this outcome, nor my results, but I acknowledge that trading is not an easy career and that there will be multiple obstacles along a way with no signs.

Another interesting discovery during this couple months of no posting was that I was no longer interested in stock picks/alerts and I mean all of them: Not those from Jason Bond nor Tim Sykes nor ClayTrader. Don't get me wrong, those guys are legit and each has a successful trading style.

But for some reason my interest in being self sufficient is stronger than ever. I have a deep desire of building a trading style of my own. Of course I'll be checking out all the learning material of those newsletter that I'm subscribed to, but I'm no longer interested in their picks.

From now on I'm focused on developing my own trading style, a style that deeply resonates within myself, as I think every aspiring trader should.

Thats pretty much all I had to say.

I'll be doing more posts about trading and pretty much everything that catches my eye and think that its worth sharing along with my watchlists.

And remember kids, "it ain't about how hard you hit, it's about how hard you can get hit and keep moving foward, how much you can take and keep moving foward, thats how winning is done!".


Share
Tweet
Pin
Share
No comentarios


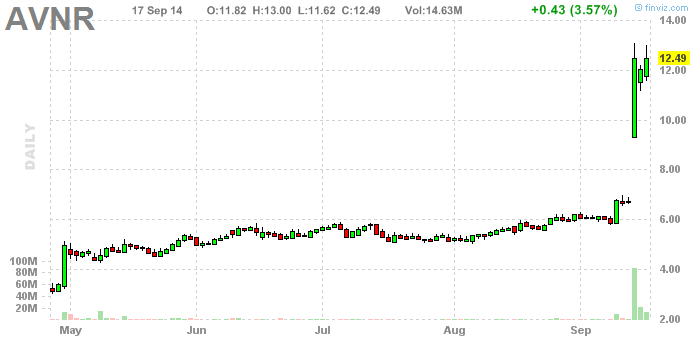
http://finviz.com/quote.ashx?t=avnrAVNR had a big move on monday and has been consolidating this past two days. There is some clear resistance at 13.00. I'll keep on watch for either a breakout above 13.00 or a failed break and subsequent breakdown.


MOBI made a big move above 10.00 today at EOD, so I expect this to be in play tomorrow. Pretty much no resistance until the mid 12s. Let's see if it can hold the double digits and move from there.


NYNY was the huge mover of today, basicly doubled from yesterday's open. Let's see if this can keep moving or if it begins to crack down, making it a good short opportunity.

I hope that you can profit from this watchlist.
I you have any other stock worth watching, please share it in the comments.

Good Luck & Have Profits.
Share
Tweet
Pin
Share
No comentarios
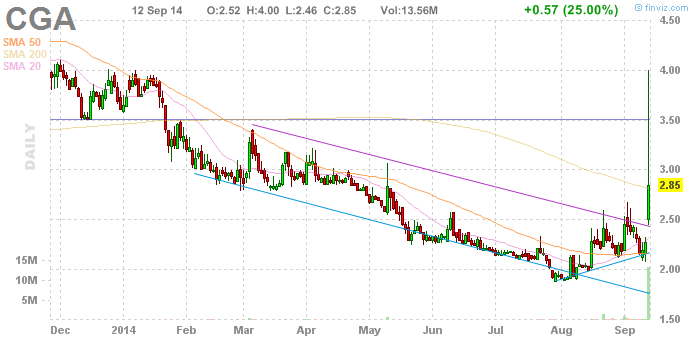
http://finviz.com/quote.ashx?t=cga

 CGA was a big mover on friday because or earnings. I'll keep on watch for a secondary move or a fade. This could also pullback to fill the gap and make a second run. Definetly to keep on watch for next week.

http://finviz.com/quote.ashx?t=OTIV
 OTIV is another of last week's big movers. It gapped, pulled abck, filled the gap and now is running again. It has some resistance at 4.00 but I think it can make a higher move next week.

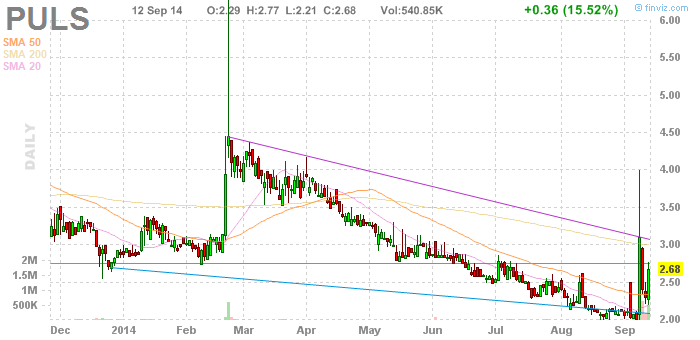
http://finviz.com/quote.ashx?t=PULS
 Another big mover. PULS ran to 4 before pulling back and now setting up for a possible move to 3.00.


http://finviz.com/quote.ashx?t=SCOK


SCOK is also another of the big movers. After the move it has been forming some sort of simetrical triangle/pennant that would indicate that a another move is possible. Will keep on watch for either the breakout or breakdown of the pennant.


I hope that you can profit from this watchlist!
I you have some other stocks worth watching, please share them in the comments!

Good Luck & Have Profits!

Share
Tweet
Pin
Share
No comentarios
SCOK had a HUUUGE run today from 3 to above 9. Right now in after hours is at 6.65 so a gap down is very likely. It made some sort of double top above 9 and can possibly colapse tomorrow.


LUNA is another stock that gapped and made a big move. It opened at 2.07 and quickly ran to 2.7 only to fade away the rest of the day. It has a big gap to fill and I think it weill be a good short tomorrow.


WPCS broke out from an ascending triangle after good news and climbed up to 1.73. It tomorrow it goes above today's highs I think it can go near 2.00.


ISNS made huge a huge move the past week and obviously it went down hard after the move was done. Now it has holded above 6 for two days with a low of 6.11 the two days. I think it can make another move to at least 7, But holding above 6 is key. It it breaks this previous days low, the it's a short.
Share
Tweet
Pin
Share
No comentarios
One thing you need to realize, is that by choosing to become a trader, you have just choosed to try another career; and as in any other career you will have to get good education in order to succeed.
Many times, traders (me included) begun by checking out some stock tips, random strategies and random tips that they found on the internet, or worse, by getting involved in a promoted, pumped & dumped stock.

When I had the realization that stock trading is very much a career on its own, I decided to focus on learning:

  • Learn all about technical analysis: Support&Resistance, Trendlines, Indicators, etc. 
  • Learn at least the basic of fundamental analysis.
  • Learn strategies from real succesful traders.
  • Learn about trade & money management.
  • Learn about emotional control. Trust me, you will need it.
Finally, discover what trading style suits you best. You like fast action and are quite impacient? Try out daytrading; Do you prefer playing stocks that take a couple of days to move? maybe swing trading is for you; You are incredibly pacient and recon the opportunities of big wins on the long term? Well, then you could do really well with position trading.

Of course, after education there is the second part that is practice. But as I said, as in any other career, begin by getting quality education and then test yourself and improve your skills upon what you have already learned.

To finish, I would like to share with you this 2 videos from ClayTrader. He regularly makes "Stock Trading Quick Tips" videos regularly and this 2 relate to education with very clear examples. Enjoy!


Share
Tweet
Pin
Share
No comentarios


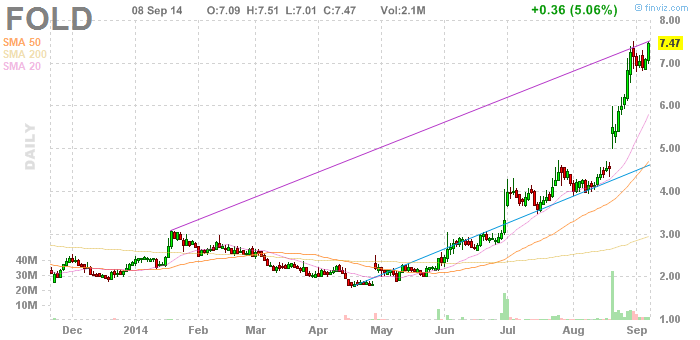
http://finviz.com/quote.ashx?t=FOLD

FOLD consolidated around 7 the last week and now seems to be going higher again. Possible goin to test 8.


http://finviz.com/quote.ashx?t=CMGE Chinese stocks seem to be hot now, and CMGE has had a big run. I think it can test 30 before going down, so I'll keep it con watch for tomorrow.


http://finviz.com/quote.ashx?t=giga GIGA had a big run and got above 3.In the chart we can see that this stock usually doesn't hold gains, but it makes a decent second day move before fading. This can be a nice daytrade and also a possible short when it fades.


http://finviz.com/quote.ashx?t=IVAN


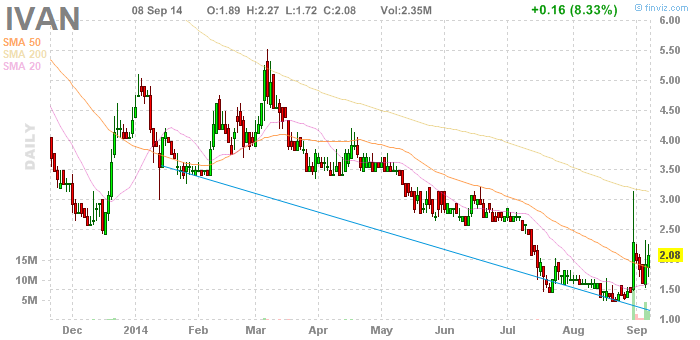
IVAN has been making nice morning moves for the past 2 days and today it consolidated almost all day right above 2. I would like to see another morning move to test previous day's highs.
Share
Tweet
Pin
Share
No comentarios
Trading is an amazing endeavor. It involves an huge emotional component that I didn't expected when I first begun and I think many traders can relate to this.

Emotions run high when you are about to get in, when you are in and when you are out of a trade.
Greed. Fear. Hope. Euphoria. Sadness. Regret. . All of those can be felt in the course of a single trade.

Sometimes you will hit a really bad trade that makes you feel like an idiot, or you will go through a losing streak that will make you question yourself if you are really going to succeed at trading. That kind of event can really affect your emotional state and in turn, affect your trading even more.

In those cases, I like to remember that I must believe in myself! 
I must remember that succeeding at trading is possible, it has been done.
I must remember that most successful traders had a hard time their first months or even years; they burned several accounts become they became consistently profitable.
I remember that I must keep going.
I must learn from my mistakes;
I must review what is working for me and what not.
I must focus on what I'm doing right and avoid what I've done wrong.

I must believe in my strategy.
I must believe in my skills.
I will believe in myself.


Share
Tweet
Pin
Share
No comentarios
Here's some stocks that  I'll be watching for next monday and possible all week.

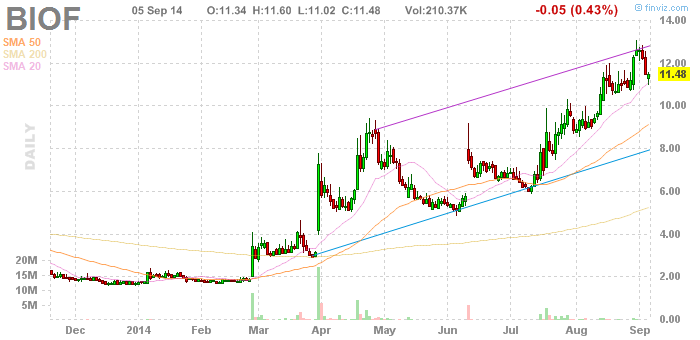
http://finviz.com/screener.ashx?v=341&ft=3&o=ticker&t=BIOFBIOF has been trending nicely the las couple of months. Last friday it pulle d back to it's 20sma and formed some sort of hammer, that makes me think that it could be getting ready to go back to 13 or above. Holding above the 20sma is KEY.


http://finviz.com/screener.ashx?v=341&ft=3&o=ticker&t=CBK
 CBK is breaking out and nearing it's 4 year high at 11.60, so it's a good spot for either a breakout or a breakdown.


http://finviz.com/screener.ashx?v=341&ft=3&o=ticker&t=CUR
 Similar setup as BIOF. It has been trending up nicely the last month and has now pulled back. Possibble move to 4. Again, holding the 20sma is key.


http://finviz.com/screener.ashx?v=341&ft=3&o=ticker&t=EVRY
 I really like this one. EVRY formed a wedge/simetrical triangle, broke to the upside and seems to be heading to 4.00.


http://finviz.com/screener.ashx?v=341&ft=3&o=ticker&t=MITK
 MITK one last week big movers. After good news, MITK gapped up and spiked above 4.00 Now it has pulled back and seems to have found support around 3. I'm looking for it to head back to at least the 3.50s and proably retest 4.00.


http://finviz.com/screener.ashx?v=341&ft=3&o=ticker&t=MOBI
 MOBI had news about stock repurchase and that sent MOBI price to above 9. It is looking strong and it has proved in the past that i can make huge moves, so a move to 10.00 is quite likely.


http://finviz.com/screener.ashx?v=341&ft=3&o=ticker&t=SYN

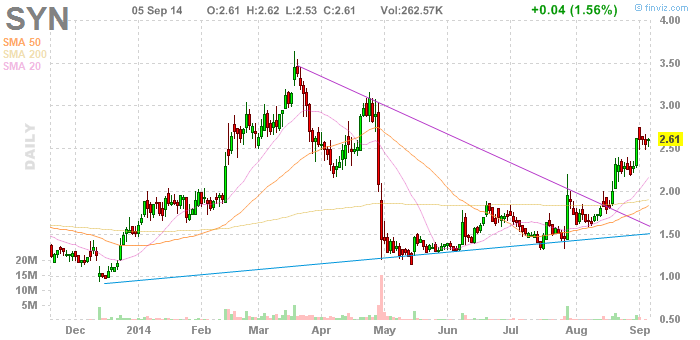
SYN has been also uptrending for the last couple of  months, making nice sharp moves followed by a period of consolidation. It seems that it could end that period of consolidation next week and possibly head to 3.00. Nice range and good risk reward considering that it tested 2.50 a couple of times last week, making it a good stop loss area.

Thats what I'll be watching for next week with also all the Police Cameras/Equipement stocks that rallied this past week: DGLY, ISNS, VII, MAGS;They can either make a seconday move or just breakdown, which seems more likely.

I hope that you can profit from this ideas!

Good Luck & Have Profits!

Share
Tweet
Pin
Share
No comentarios
Yesterday's Watchlist Review:

ISNS: Big gap up as expected and then traded most of the day in a range around the high 9's and the mid 8's, finally breaking down at EOD. Now at 7.71 A/H.
DGLY: gapped down and faded the whole day.
HPJ: Almost reached 8 during premarket but then it was all the way down the rest of the day.
FCEL: Down all day, now at 2.53 A/H.

SGOC made a huge move into the close and it's still climbing after hours, so a gap up is to be expected. I don't know if the move will continiue but its definitly something to watch for tomorrow.

 VIMC made a big morning move and the consolidated the rest of the day. Will keep on watch for a possible move to 4.50
 ACHN is in a great uptrend lately. It' already gapped this two last days and it may continue, or maybe tomorrow will stop, making it an attractive short.

 ACWR is breaking out from previous resistance at 15.5. Will see if it retests that resistance for support before making another move.


Share
Tweet
Pin
Share
No comentarios
Newer Posts
Older Posts

About me

Hello! I'm Ivan, a developing trader.
I've been studying how to trade the stock market for the past 3 years and I want to share the things that I've have learned.
Here you will find watchlists, info about technical analysis and also book & products reviews.
I hope that you find something useful.

Disclaimer: None of the information presented on this blog is a recommendation to buy or sell any financial instrument, this is only for educational purposes.

Popular Posts

    no image Weekend Sector Analysis for 01/16/2017
    Candlesticks 5: Candlestick Pattern Dictionary Candlesticks 5: Candlestick Pattern Dictionary
    Candlesticks 1: Introduction Candlesticks 1: Introduction
    Candlesticks 2: Single Candle Formations Candlesticks 2: Single Candle Formations
    Indicators: The RSI Indicators: The RSI
    Candlesticks 4: Bearish Reversal Patterns Candlesticks 4: Bearish Reversal Patterns
    Indicators: Volume Indicators: Volume
    Indicators: The MACD Indicators: The MACD
    Alternative Candles: Heikin Ashi Alternative Candles: Heikin Ashi
    About Risk Management and Losing Streaks About Risk Management and Losing Streaks

recent posts

Blog Archive

  • ▼  2017 (2)
    • ▼  January (2)
      • Weekend Sector Analysis for 01/16/2017
      • Midweek Sector Analysis 01/11/2016
  • ►  2016 (1)
    • ►  December (1)
  • ►  2015 (7)
    • ►  September (2)
    • ►  June (1)
    • ►  April (1)
    • ►  March (2)
    • ►  February (1)
  • ►  2014 (26)
    • ►  November (5)
    • ►  October (2)
    • ►  September (11)
    • ►  August (8)
Powered by Blogger.

Created with by ThemeXpose