• Home
  • Watchlists
  • Education
    • Technical Analysis
    • Trading Psycology
    • Trading Strategies
  • Book Reviews
  • Services Reviews
    • Tim Sykes
      • Tim Sykes's Millionaire Challenge
      • Penny Stocking Silver
      • Tim Sykes DVDs
    • Jason Bond
    • Bulls on Wallstreet
    • Claytrader

Karma Trades

Remember  Heikin Ashi candles?
A couple of weeks ago I ran into an interesting video detailing a swinging strategy using Heikin Ashi candles. The strategy was easy to follow and had a win rate of above 70%. I tried it a couple of time on $TNA & $TZA. And it quite worked, so I'm sharing it with you.

While I didn't like the way he averaged down when in a losing positions, the strategy is still valid. It all depends on spoting when the momentum has changed and getting in, knowing that you have an statistical advantage, then you can decide if getting out when wrong or averaging down.

You can forward the video the minute 47:00-48:00 when he starts to explain the strategy if you want. Enjoy.


Please note, that the guy in that conference is trying to sell an automatic trading system and he mentions that towards the end. Just focus on the strategy and draw your own conclusions.

Share
Tweet
Pin
Share
No comentarios


Candlesticks are a great method to plot a chart, but there's another way to plot those candles.
It is called the Heikin Ashi Technique. This charting method uses the same principles of traditional candlesticks, but it changes the open,high,low and closing values of the candlestick.

New Values:

Close = (Open+High+Low+Close)/4 = Average price of the current bar
Open = [Open (previous bar) + Close (previous bar)]/2 = Midpoint of the previous bar
High  = Max (High,Open,Close) = Highest value in the set
Low   = Min (Low,Open, Close) = Lowest value in the set

Heikin Ashi means "Average Bar" in Japanese. But what's the point of using a candlestick that has averaged values? Well most profits (and losses) are generated when markets are trending, so predicting trends correctly can be extremely helpful. The Heikin-Ashi techniqueis one of many techniques that, used in conjunction with candlestick charts, can improve the isolation of trends and to predict future prices.

Constructing the Chart

The Heikin-Ashi chart is constructed like a regular candlestick chart (except with the new values above). The time series is defined by the user--depending on the type of chart desired (daily, hourly, etc.). The down days are represented by filled bars, while the up days are represented by empty bars. Finally, all of the same candlestick patterns apply.

Patterns

Just as with traditional candlesticks, each candle tells a story. With Hikin Ashi charts, the patterns can be reduced to three:

http://forexid.com/wp-content/uploads/2013/04/heikin-ashi-candle-patterns.png
  • Hollow candles with no lower "shadows" indicate a strong uptrend: let your profits ride!
  • Hollow candles signify an uptrend: you might want to add to your long position, and exit short positions.
  • One candle with a small body surrounded by upper and lower shadows indicates a trend change: risk-loving traders might buy or sell here, while others will wait for confirmation before going short or long.
  • Filled candles indicate a downtrend: you might want to add to your short position, and exit long positions.
  • Filled candles with no higher shadows identify a strong downtrend: stay short until there's a change in trend.


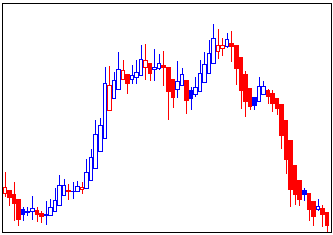
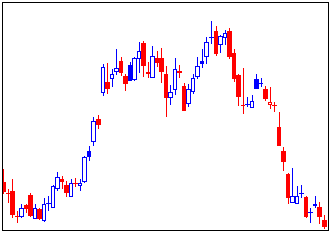
How does a Heikin Ashi chart look like?

This is a normal candlestick chart: 

092204_1.gif

This is a Heikin Ashi chart:


092204_2.gif

As you can see, the Heikin Ashi chart shows its "easier" to read. You can easily see the strong days and you can clearly spot the trend. This is the strenght of the Heikin Ashi candles, they cut all the market noise and show you the prevailing trend.

But not everything is perfect with these candles, as their opening and closing values are averaged, they are lagging behind the actual price, this means that they should be used more like and indicator than an actual way to read price action.

Despite the lag, which is based on just one period, HA Candles when used along with other technical analysis such as Support/Resistance or even moving averages can present a clearer picture to the trader, as compared to the traditional candlesticks. And in its defense, while it might seem easier to take a signal off the doji or a hammer candle pattern, Heikin Ashi, due to its lagging nature can in fact confirm a trend reversal.


Conclusions

Heikin Ashi, rather than being a "better" way to plot price action, it is best used as an indicator. This indicator is best used on trending markets, like ETFs, Forex, Commodities, and not on choppy charts, like a stock trading in a tight range or during a consolidation.

Pros

  • Makes reading a chart easier.
  • Better detection of trends and trend shifts.
  • Beginner friendly.
  • Eliminates market noise.
  • Very useful on trending markets.
  • When combined with other techniques and indicators, becomes a great tool for traders.

Cons

  • Lagging in  nature.
  • Don't show true price action.
  • Doesn't show gaps.
  • Not very useful on choppy markets. 

While Heikin Ashi candlesticks is not the ‘Holy Grail’ of trading, using these candlesticks can offer beginners a great way to observe the markets and perhaps get more meaning out of the price action as compared to using the traditional candlesticks. Every indicator’s edge is usually offset by one or more factors and Heikin Ashi candlesticks are no exception. While giving the trader the edge of eliminating market noise, the HA Candles tend to lag in nature. As always, reading the signals from HA Candlesticks and confirming the same with other technical indicators is always a good practice.

If you want an example of a Heikin Ashi Swing Trading Strategy, check this out:  Heikin Ashi Swing Trading

Share
Tweet
Pin
Share
1 comentarios
Older Posts

About me

Hello! I'm Ivan, a developing trader.
I've been studying how to trade the stock market for the past 3 years and I want to share the things that I've have learned.
Here you will find watchlists, info about technical analysis and also book & products reviews.
I hope that you find something useful.

Disclaimer: None of the information presented on this blog is a recommendation to buy or sell any financial instrument, this is only for educational purposes.

Popular Posts

    no image Weekend Sector Analysis for 01/16/2017
    Candlesticks 5: Candlestick Pattern Dictionary Candlesticks 5: Candlestick Pattern Dictionary
    Alternative Candles: Heikin Ashi Alternative Candles: Heikin Ashi
    Candlesticks 4: Bearish Reversal Patterns Candlesticks 4: Bearish Reversal Patterns
    Indicators: Accumulation/Distribution Indicators: Accumulation/Distribution
    A Seminar on Trading Psycology by Mark Douglas A Seminar on Trading Psycology by Mark Douglas
    Top Ten Lessons From: Reminiscences of a Stock Operator Top Ten Lessons From: Reminiscences of a Stock Operator
    Win a new trading PC! Win a new trading PC!
    Indicators: Stochastic Oscillator Indicators: Stochastic Oscillator
    Watchlist for Tuesday 09/08/2015 Watchlist for Tuesday 09/08/2015

recent posts

Blog Archive

  • ▼  2017 (2)
    • ▼  January (2)
      • Weekend Sector Analysis for 01/16/2017
      • Midweek Sector Analysis 01/11/2016
  • ►  2016 (1)
    • ►  December (1)
  • ►  2015 (7)
    • ►  September (2)
    • ►  June (1)
    • ►  April (1)
    • ►  March (2)
    • ►  February (1)
  • ►  2014 (26)
    • ►  November (5)
    • ►  October (2)
    • ►  September (11)
    • ►  August (8)
Powered by Blogger.

Created with by ThemeXpose