• Home
  • Watchlists
  • Education
    • Technical Analysis
    • Trading Psycology
    • Trading Strategies
  • Book Reviews
  • Services Reviews
    • Tim Sykes
      • Tim Sykes's Millionaire Challenge
      • Penny Stocking Silver
      • Tim Sykes DVDs
    • Jason Bond
    • Bulls on Wallstreet
    • Claytrader

Karma Trades


What is it? 


The Moving Average Convergence Divergence, also known as MACD, is a trend following and momentum indicator that is based on the relationship between two moving averages.

How is it calculated?

It is calculared by substracting the 26 day Exponential Moving Average (EMA) from the 12 day EMA and plotting it, that's the MACD; then another 9 day EMA is plotted and it is called the signal line.


How to use it:

There are three common methods used to interpret the MACD:
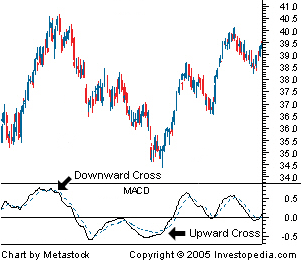
Moving Average Convergence Divergence (MACD)
1. Crossovers - As shown in the chart, when the MACD falls below the signal line, it is a bearish signal, which indicates that it may be time to sell. Conversely, when the MACD rises above the signal line, the indicator gives a bullish signal, which suggests that the price of the asset is likely to experience upward momentum. Many traders wait for a confirmed cross above the signal line before entering into a position to avoid getting getting "faked out" or entering into a position too early, as shown by the first arrow.

2. Divergence - When the security price diverges from the MACD. It signals the end of the current trend.

3. Dramatic rise - When the MACD rises dramatically - that is, the shorter moving average pulls away from the longer-term moving average - it is a signal that the security is overbought and will soon return to normal levels.

Variants

The Histogram

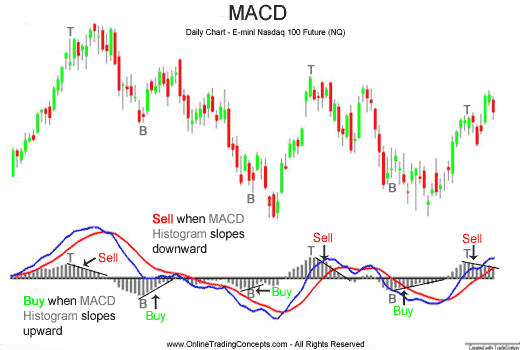
Sometimes you will have the option to plot the MACD histogram. This is a series of bars that show the distance between the MACD and the signal line.
http://www.onlinetradingconcepts.com/images/technicalanalysis/MACDbuysellaltNQ.gif


The histogram works as an early indicator for the trend change. When the histrogram's slope changes direction it is signaling a decrease on the trend momentum and then a probable trend change.

Different values

Some people like to change the MACD default values to better suit their trading style. One popular set of values is 13 for the long term EMA, 6 for the short term and 5 for the signal line.

This will make the MACD more responsive to price movements and it's useful when trading shorter timeframes.

Share
Tweet
Pin
Share
No comentarios


Candlesticks are a great method to plot a chart, but there's another way to plot those candles.
It is called the Heikin Ashi Technique. This charting method uses the same principles of traditional candlesticks, but it changes the open,high,low and closing values of the candlestick.

New Values:

Close = (Open+High+Low+Close)/4 = Average price of the current bar
Open = [Open (previous bar) + Close (previous bar)]/2 = Midpoint of the previous bar
High  = Max (High,Open,Close) = Highest value in the set
Low   = Min (Low,Open, Close) = Lowest value in the set

Heikin Ashi means "Average Bar" in Japanese. But what's the point of using a candlestick that has averaged values? Well most profits (and losses) are generated when markets are trending, so predicting trends correctly can be extremely helpful. The Heikin-Ashi techniqueis one of many techniques that, used in conjunction with candlestick charts, can improve the isolation of trends and to predict future prices.

Constructing the Chart

The Heikin-Ashi chart is constructed like a regular candlestick chart (except with the new values above). The time series is defined by the user--depending on the type of chart desired (daily, hourly, etc.). The down days are represented by filled bars, while the up days are represented by empty bars. Finally, all of the same candlestick patterns apply.

Patterns

Just as with traditional candlesticks, each candle tells a story. With Hikin Ashi charts, the patterns can be reduced to three:

http://forexid.com/wp-content/uploads/2013/04/heikin-ashi-candle-patterns.png
  • Hollow candles with no lower "shadows" indicate a strong uptrend: let your profits ride!
  • Hollow candles signify an uptrend: you might want to add to your long position, and exit short positions.
  • One candle with a small body surrounded by upper and lower shadows indicates a trend change: risk-loving traders might buy or sell here, while others will wait for confirmation before going short or long.
  • Filled candles indicate a downtrend: you might want to add to your short position, and exit long positions.
  • Filled candles with no higher shadows identify a strong downtrend: stay short until there's a change in trend.


How does a Heikin Ashi chart look like?

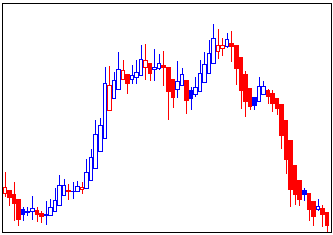
This is a normal candlestick chart: 

092204_1.gif

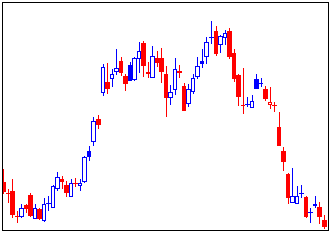
This is a Heikin Ashi chart:


092204_2.gif

As you can see, the Heikin Ashi chart shows its "easier" to read. You can easily see the strong days and you can clearly spot the trend. This is the strenght of the Heikin Ashi candles, they cut all the market noise and show you the prevailing trend.

But not everything is perfect with these candles, as their opening and closing values are averaged, they are lagging behind the actual price, this means that they should be used more like and indicator than an actual way to read price action.

Despite the lag, which is based on just one period, HA Candles when used along with other technical analysis such as Support/Resistance or even moving averages can present a clearer picture to the trader, as compared to the traditional candlesticks. And in its defense, while it might seem easier to take a signal off the doji or a hammer candle pattern, Heikin Ashi, due to its lagging nature can in fact confirm a trend reversal.


Conclusions

Heikin Ashi, rather than being a "better" way to plot price action, it is best used as an indicator. This indicator is best used on trending markets, like ETFs, Forex, Commodities, and not on choppy charts, like a stock trading in a tight range or during a consolidation.

Pros

  • Makes reading a chart easier.
  • Better detection of trends and trend shifts.
  • Beginner friendly.
  • Eliminates market noise.
  • Very useful on trending markets.
  • When combined with other techniques and indicators, becomes a great tool for traders.

Cons

  • Lagging in  nature.
  • Don't show true price action.
  • Doesn't show gaps.
  • Not very useful on choppy markets. 

While Heikin Ashi candlesticks is not the ‘Holy Grail’ of trading, using these candlesticks can offer beginners a great way to observe the markets and perhaps get more meaning out of the price action as compared to using the traditional candlesticks. Every indicator’s edge is usually offset by one or more factors and Heikin Ashi candlesticks are no exception. While giving the trader the edge of eliminating market noise, the HA Candles tend to lag in nature. As always, reading the signals from HA Candlesticks and confirming the same with other technical indicators is always a good practice.

If you want an example of a Heikin Ashi Swing Trading Strategy, check this out:  Heikin Ashi Swing Trading

Share
Tweet
Pin
Share
1 comentarios
Note: This post is taken directly from StockCharts's ChartSchool.


There's many other patterns that I didn't mention and, while they are not as popular or importan, I believe it is useful to have an idea of what each pattern may signal. So here's a list of over 30 patterns and a small descriptión of what they mean. Enjoy!

Abandoned Baby: A rare reversal pattern characterized by a gap followed by a Doji, which is then followed by another gap in the opposite direction. The shadows on the Doji must completely gap below or above the shadows of the first and third day.

Dark Cloud Cover: A bearish reversal pattern that continues the uptrend with a long white body. The next day opens at a new high then closes below the midpoint of the body of the first day.

Doji: Doji form when a security's open and close are virtually equal. The length of the upper and lower shadows can vary, and the resulting candlestick looks like, either, a cross, inverted cross, or plus sign. Doji convey a sense of indecision or tug-of-war between buyers and sellers. Prices move above and below the opening level during the session, but close at or near the opening level.

Downside Tasuki Gap: A continuation pattern with a long, black body followed by another black body that has gapped below the first one. The third day is white and opens within the body of the second day, then closes in the gap between the first two days, but does not close the gap.

Dragonfly Doji: A Doji where the open and close price are at the high of the day. Like other Doji days, this one normally appears at market turning points.

Engulfing Pattern: A reversal pattern that can be bearish or bullish, depending upon whether it appears at the end of an uptrend (bearish engulfing pattern) or a downtrend (bullish engulfing pattern). The first day is characterized by a small body, followed by a day whose body completely engulfs the previous day's body.

Evening Doji Star: A three day bearish reversal pattern similar to the Evening Star. The uptrend continues with a large white body. The next day opens higher, trades in a small range, then closes at its open (Doji). The next day closes below the midpoint of the body of the first day.

Evening Star: A bearish reversal pattern that continues an uptrend with a long white body day followed by a gapped up small body day, then a down close with the close below the midpoint of the first day.

Falling Three Methods: A bearish continuation pattern. A long black body is followed by three small body days, each fully contained within the range of the high and low of the first day. The fifth day closes at a new low.

Gravestone Doji: A doji line that develops when the Doji is at, or very near, the low of the day.

Hammer: Hammer candlesticks form when a security moves significantly lower after the open, but rallies to close well above the intraday low. The resulting candlestick looks like a square lollipop with a long stick. If this candlestick forms during a decline, then it is called a Hammer.

Hanging Man: Hanging Man candlesticks form when a security moves significantly lower after the open, but rallies to close well above the intraday low. The resulting candlestick looks like a square lollipop with a long stick. If this candlestick forms during an advance, then it is called a Hanging Man.

Harami: A two day pattern that has a small body day completely contained within the range of the previous body, and is the opposite color.

Harami Cross: A two day pattern similar to the Harami. The difference is that the last day is a Doji.

Inverted Hammer: A one day bullish reversal pattern. In a downtrend, the open is lower, then it trades higher, but closes near its open, therefore looking like an inverted lollipop.

Long Day: A long day represents a large price move from open to close, where the length of the candle body is long.

Long-Legged Doji: This candlestick has long upper and lower shadows with the Doji in the middle of the day's trading range, clearly reflecting the indecision of traders.

Long Shadows: Candlesticks with a long upper shadow and short lower shadow indicate that buyers dominated during the first part of the session, bidding prices higher. Conversely, candlesticks with long lower shadows and short upper shadows indicate that sellers dominated during the first part of the session, driving prices lower.

Marubozu: A candlestick with no shadow extending from the body at either the open, the close or at both. The name means close-cropped or close-cut in Japanese, though other interpretations refer to it as Bald or Shaven Head.

Morning Doji Star: A three day bullish reversal pattern that is very similar to the Morning Star. The first day is in a downtrend with a long black body. The next day opens lower with a Doji that has a small trading range. The last day closes above the midpoint of the first day.

Morning Star: A three day bullish reversal pattern consisting of three candlesticks - a long-bodied black candle extending the current downtrend, a short middle candle that gapped down on the open, and a long-bodied white candle that gapped up on the open and closed above the midpoint of the body of the first day.

Piercing Line: A bullish two day reversal pattern. The first day, in a downtrend, is a long black day. The next day opens at a new low, then closes above the midpoint of the body of the first day.

Rising Three Methods: A bullish continuation pattern in which a long white body is followed by three small body days, each fully contained within the range of the high and low of the first day. The fifth day closes at a new high.

Shooting Star: A single day pattern that can appear in an uptrend. It opens higher, trades much higher, then closes near its open. It looks just like the Inverted Hammer except that it is bearish.

Short Day: A short day represents a small price move from open to close, where the length of the candle body is short.
Spinning Top: Candlestick lines that have small bodies with upper and lower shadows that exceed the length of the body. Spinning tops signal indecision.

Stars: A candlestick that gaps away from the previous candlestick is said to be in star position. Depending on the previous candlestick, the star position candlestick gaps up or down and appears isolated from previous price action.

Stick Sandwich: A bullish reversal pattern with two black bodies surrounding a white body. The closing prices of the two black bodies must be equal. A support price is apparent and the opportunity for prices to reverse is quite good.

Three Black Crows: A bearish reversal pattern consisting of three consecutive long black bodies where each day closes at or near its low and opens within the body of the previous day.

Three White Soldiers: A bullish reversal pattern consisting of three consecutive long white bodies. Each should open within the previous body and the close should be near the high of the day.

Upside Gap Two Crows: A three day bearish pattern that only happens in an uptrend. The first day is a long white body followed by a gapped open with the small black body remaining gapped above the first day. The third day is also a black day whose body is larger than the second day and engulfs it. The close of the last day is still above the first long white day.

Upside Tasuki Gap:A continuation pattern with a long white body followed by another white body that has gapped above the first one. The third day is black and opens within the body of the second day, then closes in the gap between the first two days, but does not close the gap.


Share
Tweet
Pin
Share
17 comentarios
Just as there are Bullish Reversal Patterns,  there are Bearish Reversal Patterns that will signal the end of a bullish trend and a shift in momentum. These patterns are very similar to those on the bullish side, just that they are inverted. These patterns are:

Shooting Star

The shooting star pattern is the bearish counterpart of the hammer. It is composed by a small body and a long upper shadow. This pattern usually appears at the end of a bullish trend and just as in the hammer, the longer the upper shadow the more bearish the pattern becomes.


What's happening when a Shooting Star pattern appears?
At first, there's strong buying pressure but as the stock keeps rising, it meets resistance and that means selling. As more people continiue to sell durint the day, the stock pullbacks harder and ends up closing near it's open or even lower.

Just as with the hammer, you should wait for some bearish confirmation before being sure that the trend has reversed.

ChevronTexaco (CVX) Candlestick Shooting Star example chart from StockCharts.com

After an advance that was punctuated by a long white candlestick, Chevron (CHV)[Chv] formed a shooting star candlestick above 90 (red oval). The bearish reversal pattern was confirmed with a gap down the following day


Bearish Engulfing

The counter-part of the bullish engulfing pattern, the bearish engulfing pattern consists of two candlesticks: the first is white and the second black. The size of the white candlestick is not that important, but should not be a doji, which would be relatively easy to engulf. The second should be a long black candlestick. The bigger it is, the more bearish the reversal. The black body must totally engulf the body of the first white candlestick. Ideally, the black body should engulf the shadows as well, but this is not a requirement.

What's happening when a bearish engulfing pattern appears? 
After an advance, the second black candlestick begins to form when residual buying pressure causes the security to open above the previous close. However, sellers step in after this opening gap up and begin to drive prices down. By the end of the session, selling becomes so intense that prices move below the previous open. The resulting candlestick engulfs the previous day's body and creates a potential short-term reversal.

Further weakness is required for bearish confirmation of this reversal pattern.

Example:
Ford Motor Co. (F) Candlestick Bearish Engulfing example chart from StockCharts.com
After meeting resistance around 30 in mid-January, Ford (F)[F] formed a bearish engulfing (red oval). The pattern was immediately confirmed with a decline and subsequent support break. 

Dark Cloud Cover

The dark cloud cover pattern is the bearish counter-part of the Piercing Pattern. It is composed of two candlesticks, one white and one black. The black candle should open above the previous close and close somewhere between the body of the previous candle. The closer it closes to the previous candle open, the more bearish it is.

What's happening when a bearish engulfing pattern appears? 
Just as with the bearish engulfing pattern, residual buying pressure forces prices higher on the open, creating an opening gap above the white candlestick's body. However, sellers step in after the strong open and push prices lower. The intensity of the selling drives prices below the midpoint of the white candlestick's body.

Further weakness is required for bearish confirmation of this reversal pattern.

Example:
Citigroup, Inc. (C) Candlestick Dark Cloud Cover example chart from StockCharts.com
After a sharp advance from 37 1/2 to 40.5 in about 2 weeks, Citigroup (C)[C] formed a dark cloud cover pattern (red oval). This pattern was confirmed with two long black candlesticks and marked an abrupt reversal around 40.5. 

Bearish Harami

As I explained in the previous chapter, there are four possible combinations for a harami pattern: white/white, white/black, black/white and black/black. The bullish or bearish nature of a harami depends on the preceding trend. Harami are considered potential bearish reversals after an advance and potential bullish reversals after a decline. No matter what the color of the first candlestick, the smaller the body of the second candlestick is, the more likely the reversal. If the small candlestick is a doji, the chances of a reversal increase.
Candlestick Harami example from StockCharts.com
In his book, Beyond Candlesticks, Steve Nison asserts that any combination of colors can form a harami, but the most bearish are those that form with a black/white or black/black combination.


What's happening when a bearish Harami pattern appears?  
Because the first candlestick has a large body, it implies that the bearish reversal pattern would be stronger if this body were black. This would indicate a sudden and sustained increase in selling pressure. The small candlestick afterwards indicates consolidation before continuation. After an advance, black/white or black/black bearish harami are not as common as white/black or white/white variations. A white/black or white/white combination can still be regarded as a bearish harami and signal a potential reversal. 
The first long white candlestick forms in the direction of the trend. It signals that significant buying pressure remains, but could also indicate excessive bullishness. Immediately following, the small candlestick forms with a gap down on the open, indicating a sudden shift towards the sellers and a potential reversal.
Ameritrade Holding Corp. (AMTD) Candlestick Bearish Harami example chart from StockCharts.com
After a gap up and rapid advance to 30, Ameritrade (AMTD)[Amtd] formed a bearish harami (red oval). This harami consists of a long black candlestick and a small black candlestick. The decline two days later confirmed the bearish harami and the stock fell to the low twenties.

Evening Star

The evening star is the counter-part of the morning star pattern, it consists of three candlesticks:
  1. A long white candlestick.
  2. A small white or black candlestick that gaps above the close (body) of the previous candlestick. This candlestick can also be a doji, in which case the pattern would be an evening doji star.
  3. A long black candlestick.

What's happening when a bearish Harami pattern appears?   
The long white candlestick confirms that buying pressure remains strong and the trend is up. When the second candlestick gaps up, it provides further evidence of residual buying pressure. However, the advance ceases or slows significantly after the gap and a small candlestick forms, indicating indecision and a possible reversal of trend. If the small candlestick is a doji, the chances of a reversal increase. The third long black candlestick provides bearish confirmation of the reversal.

Example:
AT&T Corp. (T) Candlestick Evening Star example chart from StockCharts.com
After advancing from 68 to 91 in about two weeks, AT&T (T)[T] formed an evening star (red oval). The middle candlestick is a spinning top, which indicates indecision and possible reversal. The gap above 91 was reversed immediately with a long black candlestick. Even though the stock stabilized in the next few days, it never exceeded the top of the long black candlestick and subsequently fell below 75.


How to confirm a reversal pattern?


There will be times when one of these patterns form and, still, the trend won't change. So, then, how can be we confirm that a reversal pattern truly indicate a shift in trend? 


The answer: VOLUME. Volume is the indicator that is going to help you confirm a reversal pattern. If a reversal pattern forms with little volume, it means that just a few traders were involved those days, but if the reversal pattern includes a lot of volume, it means that there's more people selling as well as traders shorting the stock, so both sides combine, resulting in high volume days. Always take volume into consideration.
 

Share
Tweet
Pin
Share
No comentarios
Older Posts

About me

Hello! I'm Ivan, a developing trader.
I've been studying how to trade the stock market for the past 3 years and I want to share the things that I've have learned.
Here you will find watchlists, info about technical analysis and also book & products reviews.
I hope that you find something useful.

Disclaimer: None of the information presented on this blog is a recommendation to buy or sell any financial instrument, this is only for educational purposes.

Popular Posts

    Candlesticks 5: Candlestick Pattern Dictionary Candlesticks 5: Candlestick Pattern Dictionary
    no image Weekend Sector Analysis for 01/16/2017
    Alternative Candles: Heikin Ashi Alternative Candles: Heikin Ashi
    Indicators: Accumulation/Distribution Indicators: Accumulation/Distribution
    Candlesticks 4: Bearish Reversal Patterns Candlesticks 4: Bearish Reversal Patterns
    Top Ten Lessons From: Reminiscences of a Stock Operator Top Ten Lessons From: Reminiscences of a Stock Operator
    A Seminar on Trading Psycology by Mark Douglas A Seminar on Trading Psycology by Mark Douglas
    Indicators: Stochastic Oscillator Indicators: Stochastic Oscillator
    Win a new trading PC! Win a new trading PC!
    Candlesticks 1: Introduction Candlesticks 1: Introduction

recent posts

Blog Archive

  • ▼  2017 (2)
    • ▼  January (2)
      • Weekend Sector Analysis for 01/16/2017
      • Midweek Sector Analysis 01/11/2016
  • ►  2016 (1)
    • ►  December (1)
  • ►  2015 (7)
    • ►  September (2)
    • ►  June (1)
    • ►  April (1)
    • ►  March (2)
    • ►  February (1)
  • ►  2014 (26)
    • ►  November (5)
    • ►  October (2)
    • ►  September (11)
    • ►  August (8)
Powered by Blogger.

Created with by ThemeXpose