• Home
  • Watchlists
  • Education
    • Technical Analysis
    • Trading Psycology
    • Trading Strategies
  • Book Reviews
  • Services Reviews
    • Tim Sykes
      • Tim Sykes's Millionaire Challenge
      • Penny Stocking Silver
      • Tim Sykes DVDs
    • Jason Bond
    • Bulls on Wallstreet
    • Claytrader

Karma Trades

What is it?

It's a momentum indicator that tracks the relationship between volume and price. It is often considered a leading indicator because it shows when a stock is being accumulated or distributed, foreshadowing major price moves. Again, volume precedes price.

How is it calculated?

The indicator has a three step calculation:
  1. Money Flow Multiplier = [(close  -  low) - (high - close)] /(high - low) 
 
  2. Money Flow Volume = Money Flow Multiplier x volume for the period
 
  3. Accumulation/Distribution= previous Accumulation/Distribution + current period's Money Flow Volume

How to use it?

This indicator is mainly used to confirm trends or spot potencial trend weakness & reversal when there is a divergence with the price trend.


Unlike the OBV, the Accum/Dist Line takes into account each individual period, giving it a different value based on if it cloed near its highs or near its lows. This means that a slightly red hammer day, won't affect the line the same way as a long red candle would, thus allowing to track the volume more accuratetly than the OBV.






Share
Tweet
Pin
Share
No comentarios

What is it?

The On Balance Volume indicator or OBV, is an indicator that focuses on the importance of volume and how it can affect a give prince and asset's momentum. OBV is based on the idea tha volume precedes price, so if a security is seein an increasing OBV it is a signal that volume is increasing during the upward price moves; when it decreases, it means the opposite, volume is increasing on the down days. 

How is it calculated?

The OBV is simply a running total of positive and negative volume during any given period.

If the closing price is above the prior close price then: 
Current OBV = Previous OBV + Current Volume

If the closing price is below the prior close price then: 
Current OBV = Previous OBV  -  Current Volume

If the closing prices equals the prior close price then:
Current OBV = Previous OBV (no change)

How to use it?

The value of the OBV line is not important, what it's important is the characteristics of the line. Firstly, the most important is the trend, this will help us find out in which direction the volume is flowing.


If we are following a trend, we would like to see the OBV moving in the same direction of the trend. That means that the trend is being supported by volume.


Another use of the OBV is to look for divergencies. When the OBV stops going higher or even begins to trend downwards while a security price is still going up, that is s sign that the existing trend is weakening and may reverse.


Chart 2  -  On Balance Volume
An example of a bullish divergence. Notice how the OBV started to trend up before the price did.


The on-balance volume measure is one of the least complex volume indicators that try to measure price and volume together. While there are more complex indicators, it is the ease of understanding and use that make this volume indicator so popular.


Share
Tweet
Pin
Share
No comentarios

What is it?


A stochastic oscillator is a momentum indicator that compares a scurity's closing price to its price range over a given period of time. This oscilator usually has two lines: "%K" that acts as a signal line; the other line is "%D" which is usually a 3-period moving average of %K

How is it calculated?

 
%K = (Current Close - Lowest Low)/(Highest High - Lowest Low) * 100
%D = 3-day SMA of %K

Lowest Low = lowest low for the look-back period
Highest High = highest high for the look-back period
%K is multiplied by 100 to move the decimal point two places

How to use it?

The theory behind this indicator is that in an upward-trending market, prices tend to close near their high, and during a downward-trending market, prices tend to close near their low. Transaction signals occur when the %K crosses through a three-period moving average called the "%D". 


Just like the RSI, the stochastic oscilator can also be used to identify oversold and overbought market conditions.When the stochastic is above 80, it is considered to be overbought; when it is below 20, it is considered to be oversold.

Variants


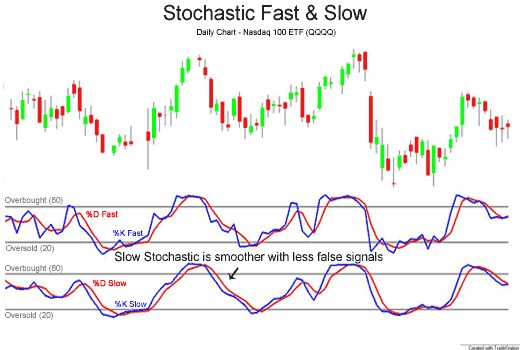
There are 2 main variants of the stochastic oscillator: The Fast & Slow Stochastic.
 
Fast Stochastic Oscillator: This is the basic formula explained above.
  • Fast %K = %K basic calculation
  • Fast %D = 3-period SMA of Fast %K
Slow Stochastic Oscillator: This form of the stochastic is used to further smooth both the %K and %D lines, reducing the number of false signals.
  • Slow %K = Fast %K smoothed with 3-period SMA
  • Slow %D = 3-period SMA of Slow %K

Comparisons and Contrasts with the RSI

While they are similar and also have similar goals, the way that each of these momentum indicators are calculated makes them better suited for different situations.

The RSI takes the last "n" periods and divides the gross positive changes per period by the gross negative changes. This means that the more often prices move higher in that "n" period span and the greater those changes become, the higher the RSI value.

A Stochastic is the measurement of the placement of a current price within a recent trading range. The theory is that as prices rise, closes tend to occur nearer to the high end of their recent range. When prices trend higher and closes begin to sag within the range it signals internal market weakness.

Simply stated, the Relative Strength Index yields the most meaningful results in trending markets while Stochastics work best in flat or choppy markets. The RSI, as mentioned, helps determine when a price has moved too far too fast. This implies a trending market. Stochastics help determine when a price has moved to the top or bottom of a trading range, which implies a non-trending (flat or choppy) market.


Share
Tweet
Pin
Share
No comentarios

What is it?

Volume is a very simple indicator but also a very powerful one if used correctly. It is a measure of how many shares of contracts of any given financial asset has been trader in a given period of time.

How is it calculated?

Volume is just a count for al the shares that were traded that day. If a buyer of a stock purchases 100 shares from a seller, then the volume for that period increases by 100 shares based on that transaction.

How to use it?

Volume is usually seen as an histogram at the bottom of a price chart. Each bar represents the volume of each period.

Volume is used to measure the worth of a market move. If the markets have made strong price move either up or down the perceived strength of that move depends on the volume for that period. The higher the volume during that price move the more significant the move.

Volume in Trends 

In a rising market volume should be also increasing. This means that the market is finding new buyers to sustain the trend. Increasing price and decreasing volume show lack of interest and this is a warning of a potential reversal. 


This can be hard to wrap your mind around, but the simple fact is that a price drop (or rise) on little volume is not a strong signal. A price drop (or rise) on large volume is a stronger signal that something in the stock has fundamentally changed.


Exhaustion Moves and Volume

In a rising or falling market we can see exhaustion moves. These are generally sharp moves in price combined with also a sharp increase in volume. Exhaustion moves usually signal the potencial end of a trend.
A GLD daily chart showing a volume spike indicating a change of direction.


Participants who waited and are afraid of missing more of the move pile in at market tops, exhausting the number of buyers. At a market bottom, falling prices eventually force out large numbers of traders, resulting in volatility and increased volume.

Volume and Price Reversals

After a long price move higher or lower, if price begins to range with little price movement and heavy volume, often it indicates a reversal.


Volume and Breakouts Vs. False Breakouts

On the initial breakout from a range or other chart pattern, a rise in volume indicates strength in the move. Little change in volume or declining volume on a breakout indicates lack of interest and a higher probability for a false breakout.
A QQQQ daily chart showing increasing volume on breakout.


Volume Indicators
 
There are many volume-based indicators that add other perpectives about how to interpret volume. I'll cover those in further posts.


Share
Tweet
Pin
Share
No comentarios

What is it?

The Relative Strenght Index or RSI is a momentum indicator that compares the magnitude of recent gains to recent losses in order to determine overbought and oversold conditions.

How is it calculated?

RSI = 100 - 100/(1 + RS*)
*Where RS = Average of x days' up closes / Average of x days' down closes.


How to use it:

The RSI is an oscilator and as such, it has upper and lower limits.
When th RSI goes above 70 it is considered overbought, meaning that it may be getting overvalued and is a good candidate for a pullback. Likewise when it goes below 30 it is considered oversold and therefore it's likely to be undervalued.


One important thing to consider is that just because a stock is oversold or overbought it means that it is a buy or a sell respectively. Any asset can stay oversold or overbought for extended periods of time. It is much better to either buy when the stock is coming out of oversold and sell when it's coming out of overbought.

Treat the RSI just as what it is, an indicator. While an oversold stock is more likely to bounce, it doesn't mean that it HAS to do it soon. Likewise an overbought stock doesn't always has to pullback soon.

Share
Tweet
Pin
Share
No comentarios

What is it? 


The Moving Average Convergence Divergence, also known as MACD, is a trend following and momentum indicator that is based on the relationship between two moving averages.

How is it calculated?

It is calculared by substracting the 26 day Exponential Moving Average (EMA) from the 12 day EMA and plotting it, that's the MACD; then another 9 day EMA is plotted and it is called the signal line.


How to use it:

There are three common methods used to interpret the MACD:

Moving Average Convergence Divergence (MACD)
1. Crossovers - As shown in the chart, when the MACD falls below the signal line, it is a bearish signal, which indicates that it may be time to sell. Conversely, when the MACD rises above the signal line, the indicator gives a bullish signal, which suggests that the price of the asset is likely to experience upward momentum. Many traders wait for a confirmed cross above the signal line before entering into a position to avoid getting getting "faked out" or entering into a position too early, as shown by the first arrow.

2. Divergence - When the security price diverges from the MACD. It signals the end of the current trend.

3. Dramatic rise - When the MACD rises dramatically - that is, the shorter moving average pulls away from the longer-term moving average - it is a signal that the security is overbought and will soon return to normal levels.

Variants

The Histogram

Sometimes you will have the option to plot the MACD histogram. This is a series of bars that show the distance between the MACD and the signal line.
http://www.onlinetradingconcepts.com/images/technicalanalysis/MACDbuysellaltNQ.gif


The histogram works as an early indicator for the trend change. When the histrogram's slope changes direction it is signaling a decrease on the trend momentum and then a probable trend change.

Different values

Some people like to change the MACD default values to better suit their trading style. One popular set of values is 13 for the long term EMA, 6 for the short term and 5 for the signal line.

This will make the MACD more responsive to price movements and it's useful when trading shorter timeframes.

Share
Tweet
Pin
Share
No comentarios
What happened is that I opened a Suretrader Account and tried out daytrading.

The result?

Well, lets say that daytrading is not for me at the moment and I'm switching back to Swing Trading.
Finding out what trading style is best for you is one of the most important steps to building a successful trading career. Finding out that Daytrading is probably not for me was a costly but important lesson. You can clearly see all this in my profitly profit chart.

I'm definetly not proud about this outcome, nor my results, but I acknowledge that trading is not an easy career and that there will be multiple obstacles along a way with no signs.

Another interesting discovery during this couple months of no posting was that I was no longer interested in stock picks/alerts and I mean all of them: Not those from Jason Bond nor Tim Sykes nor ClayTrader. Don't get me wrong, those guys are legit and each has a successful trading style.

But for some reason my interest in being self sufficient is stronger than ever. I have a deep desire of building a trading style of my own. Of course I'll be checking out all the learning material of those newsletter that I'm subscribed to, but I'm no longer interested in their picks.

From now on I'm focused on developing my own trading style, a style that deeply resonates within myself, as I think every aspiring trader should.

Thats pretty much all I had to say.

I'll be doing more posts about trading and pretty much everything that catches my eye and think that its worth sharing along with my watchlists.

And remember kids, "it ain't about how hard you hit, it's about how hard you can get hit and keep moving foward, how much you can take and keep moving foward, thats how winning is done!".


Share
Tweet
Pin
Share
No comentarios


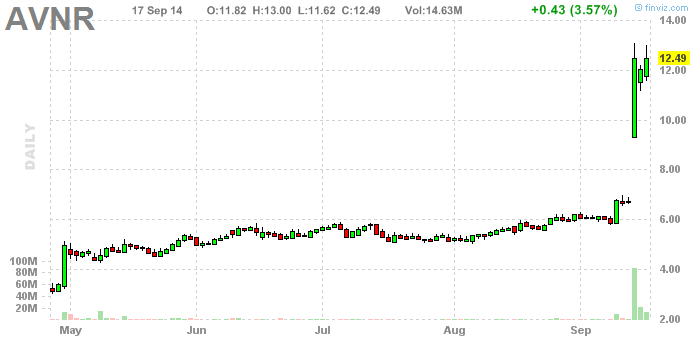
http://finviz.com/quote.ashx?t=avnrAVNR had a big move on monday and has been consolidating this past two days. There is some clear resistance at 13.00. I'll keep on watch for either a breakout above 13.00 or a failed break and subsequent breakdown.


MOBI made a big move above 10.00 today at EOD, so I expect this to be in play tomorrow. Pretty much no resistance until the mid 12s. Let's see if it can hold the double digits and move from there.


NYNY was the huge mover of today, basicly doubled from yesterday's open. Let's see if this can keep moving or if it begins to crack down, making it a good short opportunity.

I hope that you can profit from this watchlist.
I you have any other stock worth watching, please share it in the comments.

Good Luck & Have Profits.
Share
Tweet
Pin
Share
No comentarios
http://finviz.com/quote.ashx?t=cga

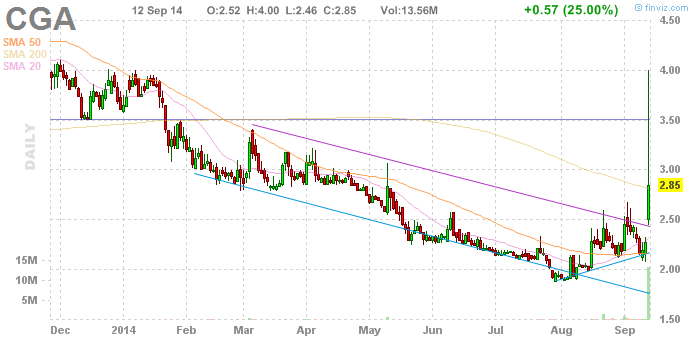
 CGA was a big mover on friday because or earnings. I'll keep on watch for a secondary move or a fade. This could also pullback to fill the gap and make a second run. Definetly to keep on watch for next week.

http://finviz.com/quote.ashx?t=OTIV
 OTIV is another of last week's big movers. It gapped, pulled abck, filled the gap and now is running again. It has some resistance at 4.00 but I think it can make a higher move next week.

http://finviz.com/quote.ashx?t=PULS
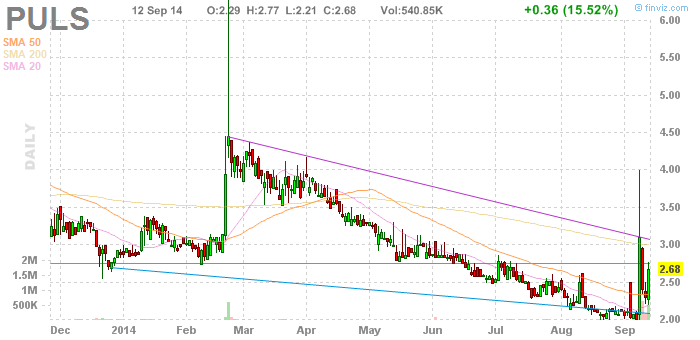
 Another big mover. PULS ran to 4 before pulling back and now setting up for a possible move to 3.00.


http://finviz.com/quote.ashx?t=SCOK


SCOK is also another of the big movers. After the move it has been forming some sort of simetrical triangle/pennant that would indicate that a another move is possible. Will keep on watch for either the breakout or breakdown of the pennant.


I hope that you can profit from this watchlist!
I you have some other stocks worth watching, please share them in the comments!

Good Luck & Have Profits!

Share
Tweet
Pin
Share
No comentarios
SCOK had a HUUUGE run today from 3 to above 9. Right now in after hours is at 6.65 so a gap down is very likely. It made some sort of double top above 9 and can possibly colapse tomorrow.


LUNA is another stock that gapped and made a big move. It opened at 2.07 and quickly ran to 2.7 only to fade away the rest of the day. It has a big gap to fill and I think it weill be a good short tomorrow.


WPCS broke out from an ascending triangle after good news and climbed up to 1.73. It tomorrow it goes above today's highs I think it can go near 2.00.


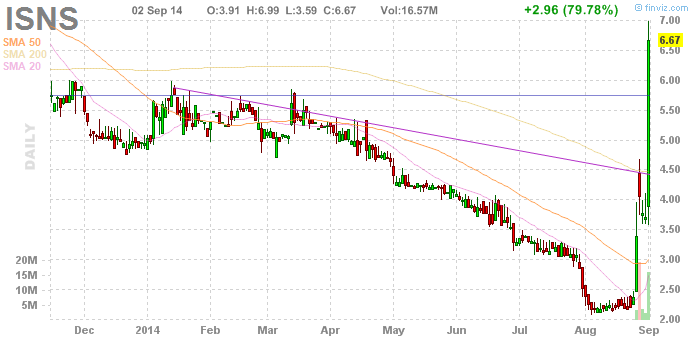
ISNS made huge a huge move the past week and obviously it went down hard after the move was done. Now it has holded above 6 for two days with a low of 6.11 the two days. I think it can make another move to at least 7, But holding above 6 is key. It it breaks this previous days low, the it's a short.
Share
Tweet
Pin
Share
No comentarios
One thing you need to realize, is that by choosing to become a trader, you have just choosed to try another career; and as in any other career you will have to get good education in order to succeed.
Many times, traders (me included) begun by checking out some stock tips, random strategies and random tips that they found on the internet, or worse, by getting involved in a promoted, pumped & dumped stock.

When I had the realization that stock trading is very much a career on its own, I decided to focus on learning:

  • Learn all about technical analysis: Support&Resistance, Trendlines, Indicators, etc. 
  • Learn at least the basic of fundamental analysis.
  • Learn strategies from real succesful traders.
  • Learn about trade & money management.
  • Learn about emotional control. Trust me, you will need it.
Finally, discover what trading style suits you best. You like fast action and are quite impacient? Try out daytrading; Do you prefer playing stocks that take a couple of days to move? maybe swing trading is for you; You are incredibly pacient and recon the opportunities of big wins on the long term? Well, then you could do really well with position trading.

Of course, after education there is the second part that is practice. But as I said, as in any other career, begin by getting quality education and then test yourself and improve your skills upon what you have already learned.

To finish, I would like to share with you this 2 videos from ClayTrader. He regularly makes "Stock Trading Quick Tips" videos regularly and this 2 relate to education with very clear examples. Enjoy!


Share
Tweet
Pin
Share
No comentarios


http://finviz.com/quote.ashx?t=FOLD

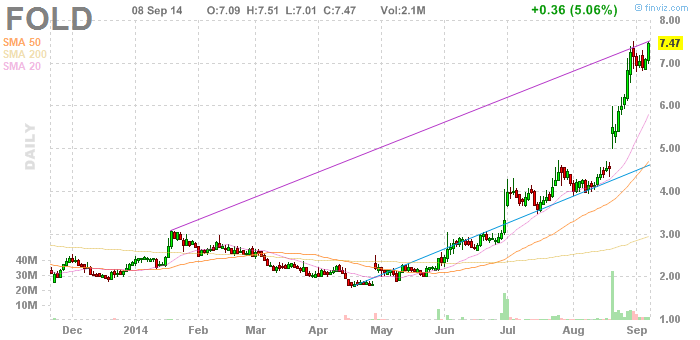
FOLD consolidated around 7 the last week and now seems to be going higher again. Possible goin to test 8.


http://finviz.com/quote.ashx?t=CMGE Chinese stocks seem to be hot now, and CMGE has had a big run. I think it can test 30 before going down, so I'll keep it con watch for tomorrow.


http://finviz.com/quote.ashx?t=giga GIGA had a big run and got above 3.In the chart we can see that this stock usually doesn't hold gains, but it makes a decent second day move before fading. This can be a nice daytrade and also a possible short when it fades.


http://finviz.com/quote.ashx?t=IVAN


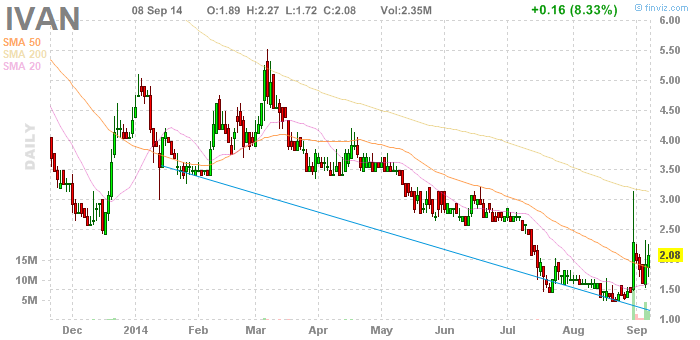
IVAN has been making nice morning moves for the past 2 days and today it consolidated almost all day right above 2. I would like to see another morning move to test previous day's highs.
Share
Tweet
Pin
Share
No comentarios
Trading is an amazing endeavor. It involves an huge emotional component that I didn't expected when I first begun and I think many traders can relate to this.

Emotions run high when you are about to get in, when you are in and when you are out of a trade.
Greed. Fear. Hope. Euphoria. Sadness. Regret. . All of those can be felt in the course of a single trade.

Sometimes you will hit a really bad trade that makes you feel like an idiot, or you will go through a losing streak that will make you question yourself if you are really going to succeed at trading. That kind of event can really affect your emotional state and in turn, affect your trading even more.

In those cases, I like to remember that I must believe in myself! 
I must remember that succeeding at trading is possible, it has been done.
I must remember that most successful traders had a hard time their first months or even years; they burned several accounts become they became consistently profitable.
I remember that I must keep going.
I must learn from my mistakes;
I must review what is working for me and what not.
I must focus on what I'm doing right and avoid what I've done wrong.

I must believe in my strategy.
I must believe in my skills.
I will believe in myself.


Share
Tweet
Pin
Share
No comentarios
Here's some stocks that  I'll be watching for next monday and possible all week.

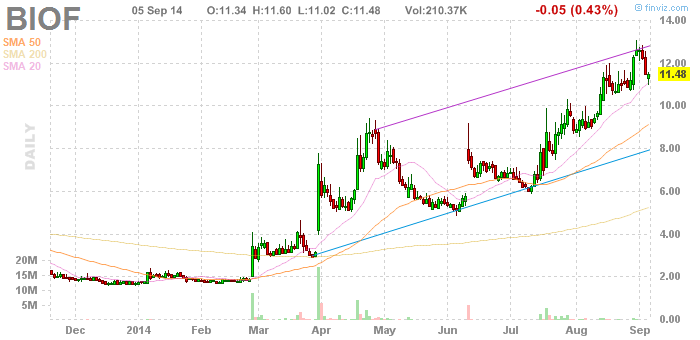
http://finviz.com/screener.ashx?v=341&ft=3&o=ticker&t=BIOFBIOF has been trending nicely the las couple of months. Last friday it pulle d back to it's 20sma and formed some sort of hammer, that makes me think that it could be getting ready to go back to 13 or above. Holding above the 20sma is KEY.


http://finviz.com/screener.ashx?v=341&ft=3&o=ticker&t=CBK
 CBK is breaking out and nearing it's 4 year high at 11.60, so it's a good spot for either a breakout or a breakdown.


http://finviz.com/screener.ashx?v=341&ft=3&o=ticker&t=CUR
 Similar setup as BIOF. It has been trending up nicely the last month and has now pulled back. Possibble move to 4. Again, holding the 20sma is key.


http://finviz.com/screener.ashx?v=341&ft=3&o=ticker&t=EVRY
 I really like this one. EVRY formed a wedge/simetrical triangle, broke to the upside and seems to be heading to 4.00.


http://finviz.com/screener.ashx?v=341&ft=3&o=ticker&t=MITK
 MITK one last week big movers. After good news, MITK gapped up and spiked above 4.00 Now it has pulled back and seems to have found support around 3. I'm looking for it to head back to at least the 3.50s and proably retest 4.00.


http://finviz.com/screener.ashx?v=341&ft=3&o=ticker&t=MOBI
 MOBI had news about stock repurchase and that sent MOBI price to above 9. It is looking strong and it has proved in the past that i can make huge moves, so a move to 10.00 is quite likely.


http://finviz.com/screener.ashx?v=341&ft=3&o=ticker&t=SYN

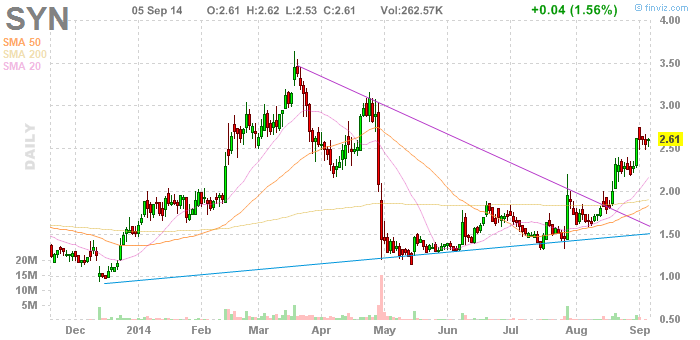
SYN has been also uptrending for the last couple of  months, making nice sharp moves followed by a period of consolidation. It seems that it could end that period of consolidation next week and possibly head to 3.00. Nice range and good risk reward considering that it tested 2.50 a couple of times last week, making it a good stop loss area.

Thats what I'll be watching for next week with also all the Police Cameras/Equipement stocks that rallied this past week: DGLY, ISNS, VII, MAGS;They can either make a seconday move or just breakdown, which seems more likely.

I hope that you can profit from this ideas!

Good Luck & Have Profits!

Share
Tweet
Pin
Share
No comentarios
Yesterday's Watchlist Review:

ISNS: Big gap up as expected and then traded most of the day in a range around the high 9's and the mid 8's, finally breaking down at EOD. Now at 7.71 A/H.
DGLY: gapped down and faded the whole day.
HPJ: Almost reached 8 during premarket but then it was all the way down the rest of the day.
FCEL: Down all day, now at 2.53 A/H.

SGOC made a huge move into the close and it's still climbing after hours, so a gap up is to be expected. I don't know if the move will continiue but its definitly something to watch for tomorrow.

 VIMC made a big morning move and the consolidated the rest of the day. Will keep on watch for a possible move to 4.50
 ACHN is in a great uptrend lately. It' already gapped this two last days and it may continue, or maybe tomorrow will stop, making it an attractive short.

 ACWR is breaking out from previous resistance at 15.5. Will see if it retests that resistance for support before making another move.


Share
Tweet
Pin
Share
No comentarios


From yesterday's watchlist:

RSH  -  Down big as expected.
GRH - Had a down day but it came back up at EOD. Possibly going to consolidate before a bigger move.
GPRO - Gapped and went above $55 only to pullback near $54 at EOD.
CLUB - 5% gain on the day and on it's way to filling that gap to $6.

For tomorrow:

http://finviz.com/quote.ashx?t=isns
I made pretty good profits today on ISNS. As of right now, ISNS is above $8 after hours, so a big gap can be expected and judge from there. It can keep spiking or maybe tomorro is the day it falls. Anyway, good to keep on watch.

http://finviz.com/quote.ashx?t=dgly
Same as ISNS, this stock is spiking hard and finished right at it's highs, I don't know how much more will it go. But as long as it keeps consolidating/breaking out is on my radar. Also when it breaks down, its going to be a GREAT short opportunity, so keep it on watch. 

http://finviz.com/quote.ashx?t=hpj
HPJ breaking out above 7 and getting really near it's 52wk highs. Will keep on watch for a break of those highs and a possible run to 8 and above.

http://finviz.com/quote.ashx?t=fcel

FCEL has been slowly trending up since May, making higher highs and higher lows each time. This time it seems is heading back up to test the highs at 2.84 with a possible move to 3. Good set up for a swing trade.

I hope that this watchlist serves you well!

Good Luck & Have Profits!


Share
Tweet
Pin
Share
No comentarios
This is the first post of my daily watchlists. I'll try to put a watchlist daily after market close, so subscribe or check out daily for trading ideas. Here's what I'm watching:


RadioShack shares skyrocketed since tuesday of last week when Standard General LP, one of RadioShack's largest shareholders, negotiates a possible rescue package with investors to stave off a bankruptcy filing.  RSH then rised near to it's 200sma before pulling back.

Depending on news this week, I see two possible outcomes, this will either pullback somewhere near the 1.50's for a later move above the 200sma  or it will crash back to 1.00 or below on negative articles. Either way, this is a stock to watch for both long & short setups.


GPRO is making new highs after breaking above $50. I think it'll pullback to test $50's support before going higher.


CLUB is sitting rightnow barely above its 50sma and it looks like it wants to fill that gap tp $6 from late July. It is important to watch if the 50sma is still resistance or if it now acts as support.


Coming out of oversold and MACD bullish crossing, if GRH crosses above the 50sma, the next resistance would be at 2.40, making it a nice trade.

I hope that you profit from this watchlist!
Good Luck and Have Profits!
Share
Tweet
Pin
Share
No comentarios
Trading is hard, don't let anyone tell you otherwise.
To succeed at trading, you will require discipline, preparation, hard work and good mindset.
Take away any of this components and you will fail.

If you ask any succesful trader at what time their day begins, they will tell you that early in the morning, some of them even before 5:00 a.m.

Trading is like a sport and just like in any sport, you must prepare yourself before the game begins.

Wake up early, way before the market opens, to prepare yourself for the trading day.

Wake up early, because you will need to check general market conditions:
  • How are futures doing today?
  • Is there any major news that could affect the market today?
Wake up early, because you must check which stocks are hot right now:
  • Which stocks are up/down premarket?
  • Which stocks have news?
  • How is your watchlist doing?
Wake up early, because you must prepare your body and mind:
  • Exercise. Go running, lift weights, do some jumping jacks, have sex; Do whatever you like, but get that blood flowing, awake the body. 
  • Meditate. Because a clear mind will always perform better; Remove any anxiety, worry or urgency before you start trading.
  • Plan. Lay a trading plan for those stocks that catched your attention. Look for support & resistance, look for optimal entry points and determine where you should exit, for both a win and a loss.
Wake up early, because you are a REAL TRADER, not a degenerate gambler.
  • You are prepared.
  • You know what you are doing.
  • You will succeed.
Wake up, Rise & Shine.


Share
Tweet
Pin
Share
No comentarios
Remember  Heikin Ashi candles?
A couple of weeks ago I ran into an interesting video detailing a swinging strategy using Heikin Ashi candles. The strategy was easy to follow and had a win rate of above 70%. I tried it a couple of time on $TNA & $TZA. And it quite worked, so I'm sharing it with you.

While I didn't like the way he averaged down when in a losing positions, the strategy is still valid. It all depends on spoting when the momentum has changed and getting in, knowing that you have an statistical advantage, then you can decide if getting out when wrong or averaging down.

You can forward the video the minute 47:00-48:00 when he starts to explain the strategy if you want. Enjoy.


Please note, that the guy in that conference is trying to sell an automatic trading system and he mentions that towards the end. Just focus on the strategy and draw your own conclusions.

Share
Tweet
Pin
Share
No comentarios
Newer Posts
Older Posts

About me

Hello! I'm Ivan, a developing trader.
I've been studying how to trade the stock market for the past 3 years and I want to share the things that I've have learned.
Here you will find watchlists, info about technical analysis and also book & products reviews.
I hope that you find something useful.

Disclaimer: None of the information presented on this blog is a recommendation to buy or sell any financial instrument, this is only for educational purposes.

Popular Posts

    Candlesticks 5: Candlestick Pattern Dictionary Candlesticks 5: Candlestick Pattern Dictionary
    no image Weekend Sector Analysis for 01/16/2017
    Candlesticks 1: Introduction Candlesticks 1: Introduction
    Candlesticks 4: Bearish Reversal Patterns Candlesticks 4: Bearish Reversal Patterns
    Alternative Candles: Heikin Ashi Alternative Candles: Heikin Ashi
    Candlesticks 2: Single Candle Formations Candlesticks 2: Single Candle Formations
    Indicators: The RSI Indicators: The RSI
    Indicators: The MACD Indicators: The MACD
    Indicators: Volume Indicators: Volume
    Watchlist for Tuesday 09/08/2015 Watchlist for Tuesday 09/08/2015

recent posts

Blog Archive

  • ►  2017 (2)
    • ►  January (2)
  • ►  2016 (1)
    • ►  December (1)
  • ►  2015 (7)
    • ►  September (2)
    • ►  June (1)
    • ►  April (1)
    • ►  March (2)
    • ►  February (1)
  • ▼  2014 (26)
    • ▼  November (5)
      • Indicators: Accumulation/Distribution
      • Indicators: On Balance Volume (OBV)
      • Indicators: Stochastic Oscillator
      • Indicators: Volume
      • Indicators: The RSI
    • ►  October (2)
      • Indicators: The MACD
      • What I've been up to.
    • ►  September (11)
      • Watchlist for Thursday 08/18/2014
      • Watchlist for Monday 09/15/2014
      • Watchlist for Wednesday 10/09/14
      • Lesson: The Importance of Education!
      • Watchlist for Tuesday 09/09/14
      • Monday Motivation: Believe in Yourself
      • Watchlist for Monday 09/08/204
      • Watchlist for Thursday 09/04/2014
      • Watchlist for Wednesday 09/03/2014
      • Watchlist for Tuesday 09/02/2014
      • Monday Motivation: Rise & Shine
    • ►  August (8)
      • Swing Trading with Heikin Ashi
Powered by Blogger.

Created with by ThemeXpose