• Home
  • Watchlists
  • Education
    • Technical Analysis
    • Trading Psycology
    • Trading Strategies
  • Book Reviews
  • Services Reviews
    • Tim Sykes
      • Tim Sykes's Millionaire Challenge
      • Penny Stocking Silver
      • Tim Sykes DVDs
    • Jason Bond
    • Bulls on Wallstreet
    • Claytrader

Karma Trades


BTU making a cup and handle pattern with the last pullback. It showed good strength the past days and I expect it to go up and break the recent high, possibly above 3.00. Energy sector conditions will be critical for this setup.


CLF another energy play. It's flagging above the recent breakout area and seems likely to continue
upward.


NES, another flag setup. It hasn't close green yet, but when it does I expect it to resume its way up.


Another Oil play, OAS, of all this is the one that I like the least because of the range. It's forming a nice pullback and setting up for a breakout but there's a previous support area from early in the year which might act as resistance at 12.00.


Good Karma & Profit.

Share
Tweet
Pin
Share
No comentarios
I've been reading many trading books this year and I thought that it would be a good idea to create a series of post about the most important lessons that I learned from those books and share it with other traders.

I will begin with one of the trading literature classics: Reminiscences of a Stock Operator by Edwin Lefevre. This book relates the story of legendary trader Jesse Livermore during the early 1900's.

Lessons:

  1. Trading is Hard.Those who believe that trading is easy money always end up losing. Becoming a profitable trader is one of the most difficult endeavors any man can take; the road will be full of dificulties, frustration, losses and more frustration, but that's the only way to really learn and master the game of speculation.
  2. The Market is Always the Same. While it might seem that the markets have radically changed from the time of the story, the truth is that the game of speculation has always been the same. That's because it's made up by the same players: Speculators, Insiders, Suckers, Manipulators, Bankers, Companies, etc. The shape of the market might have changed, but it's ways remain the same.
  3. You have to learn to lose.  Jesse Livermore lost many times during his career, sometimes even millions of dollars in a short time. Knowing how and when to take a loss is vital for a trader.
  4. Stock manipulation has always existed. Stock manipulators and promoters have always existed and will always exist. You have to be wary against extremely bullish or bearish articles, be wary against articles promoting that XYZ is the next big runner and even those who claim that their simple, easy to learn strategy will make you a millionaire! 
  5. Trade your own way. Jesse Livermore hated the tips. Don't rely on someone else for your trades. You might take an idea from someone and see if it matches with your trading style & strategy, but never, never, never trade someone else tips blindly. The way to become a succesful trader is to find your own strategy.
  6. Market conditions and general trend are more important than you think. Livermore started to have more success as a trader whe he began to pay attention to market conditions and general trend. From the book: “Obviously, the thing to do was to be bullish in a bull market and bearish in a bear market. Sounds silly, doesn’t it? But I had to grasp that general principle firmly before I saw that to put it into practice really meant to anticipate probabilities. It took me a long time to trade on those lines.” Sometimes many traders try to trade against the trend, losing many times. 
  7. Big Money is made with big positions and big patience. Livermore realizes at some point that in order to make big money and go to the next level on his trading, he would need to stop beign a "piker" and and bet with bigger positions. This is true, but is also quite dangerous to do. Before you do it, you have to be ready and that means that you MUST have a winning strategy and enough capital to sustain the losses that will certainly occur.
  8. Price Follows the Path of Least Resistance. Just like water, stock prices will go where theres is less resistance. It is your job as a trader to find that resistance and trade against it, that's the way that you gain an edge in the market.
  9.  Sometimes, the worst enemy of a trader is himself. Traders are challenged with many psycological challenges along the way. External pressures, can wreak havoc in a trader's performance. So a trader must always come to the market with the right mindset and knowing that himself is not an obstacle to success.
  10. Most traders fail.  This was perfectly clear by the end of the book, when the author mentions how Livermore and other legendary trader were unique in their own ways and even them made huge mistakes. Only a few will be able to beat the stock market and even them will likely fail at some point. Trading is a tough game.

Share
Tweet
Pin
Share
No comentarios
http://www.investorsunderground.com/giveaways/ultimate-day-trading-computer-giveaway/?lucky=8906

Investors Live is making a raffle to win a blazing fast trading pc + 1 year suscription to IU + both of their educational DVD's Tandem Trader & Texbook Trading.

I definitetly wouldn't mind improving my current station so I'm in!. 

Here's the link, and of course, the more people you invite the higher your chances!
Win a new Trading PC!
Share
Tweet
Pin
Share
No comentarios
Recently, while looking through the "Resources" section in the Lance Beggs site, a trader who was featured in Chat with Traders  (Incredible how one thing leads to another) I found the site of Adam H. Grimes, author of "The Art and Science of Technical Analysis",  who offers not only a very useful blog and also a podcast, but  also a completely free and very sound trading course.

In the world of trading its very hard to find quality educational resources that are free, but as Lance Beggs recommended it I took it. So far it's very good and I want to recommend it to any trader that wants to improve. You only have to register and thats all, no fees, no payments. He even give you a huge amount of homework to practice. (No joke here, theres a 70 page chartbook that you have to analize in the first section. I'm still doing it.)

So here's the link and enjoy!

Share
Tweet
Pin
Share
No comentarios
The other day I stumbled upon this interview with Tim Grittani and found it pretty interesting and inspiring.

One of the ideas that he shared and reallystuck with me is that he began to become consistently profitable when he started to focus on one single pattern/strategy before moving on to others. So that's going to be the way that I'll be approaching the markets from now on.

I share with you the interview so that you can also learn and get inspired by this incredible skilled trader.
Share
Tweet
Pin
Share
No comentarios
Yesterday I joined Investors Underground.
I considere this as another step in my progress and education as a trader.
Later I'll be writing a review of the service just as with the other services
So far I like that they're focused on learning how to trade instead of announcing trade alerts.
They've got 3 chatrooms: Momentum, Swing & OTC/Subpenny trades.

I must say thay I also got a nice discount by signing up for their "Free Tour" and asking for a promo code; so they gave me the same discount as their last Christmas promo, which it was 30%.
So if you're considering joinin, be sure to ask for a discount!

Share
Tweet
Pin
Share
No comentarios
Recently a friend of mine shared with me this awesome seminar by Mark Douglas, author of "The Diciplined Trader" & "Trading in the Zone", both books on trading psycology which I recommend to anyone wanting to improve their trading performance.

Anyway, this long seminar is almost as a video synthesis of both books with real examples of how to solve trading problems provided by the very attendants of the seminar.

Share
Tweet
Pin
Share
No comentarios

What is it?

It's a momentum indicator that tracks the relationship between volume and price. It is often considered a leading indicator because it shows when a stock is being accumulated or distributed, foreshadowing major price moves. Again, volume precedes price.

How is it calculated?

The indicator has a three step calculation:
  1. Money Flow Multiplier = [(close  -  low) - (high - close)] /(high - low) 
 
  2. Money Flow Volume = Money Flow Multiplier x volume for the period
 
  3. Accumulation/Distribution= previous Accumulation/Distribution + current period's Money Flow Volume

How to use it?

This indicator is mainly used to confirm trends or spot potencial trend weakness & reversal when there is a divergence with the price trend.


Unlike the OBV, the Accum/Dist Line takes into account each individual period, giving it a different value based on if it cloed near its highs or near its lows. This means that a slightly red hammer day, won't affect the line the same way as a long red candle would, thus allowing to track the volume more accuratetly than the OBV.


Share
Tweet
Pin
Share
No comentarios

What is it?

The On Balance Volume indicator or OBV, is an indicator that focuses on the importance of volume and how it can affect a give prince and asset's momentum. OBV is based on the idea tha volume precedes price, so if a security is seein an increasing OBV it is a signal that volume is increasing during the upward price moves; when it decreases, it means the opposite, volume is increasing on the down days. 

How is it calculated?

The OBV is simply a running total of positive and negative volume during any given period.

If the closing price is above the prior close price then: 
Current OBV = Previous OBV + Current Volume

If the closing price is below the prior close price then: 
Current OBV = Previous OBV  -  Current Volume

If the closing prices equals the prior close price then:
Current OBV = Previous OBV (no change)

How to use it?

The value of the OBV line is not important, what it's important is the characteristics of the line. Firstly, the most important is the trend, this will help us find out in which direction the volume is flowing.


If we are following a trend, we would like to see the OBV moving in the same direction of the trend. That means that the trend is being supported by volume.


Another use of the OBV is to look for divergencies. When the OBV stops going higher or even begins to trend downwards while a security price is still going up, that is s sign that the existing trend is weakening and may reverse.


Chart 2  -  On Balance Volume
An example of a bullish divergence. Notice how the OBV started to trend up before the price did.


The on-balance volume measure is one of the least complex volume indicators that try to measure price and volume together. While there are more complex indicators, it is the ease of understanding and use that make this volume indicator so popular.


Share
Tweet
Pin
Share
No comentarios

What is it?


A stochastic oscillator is a momentum indicator that compares a scurity's closing price to its price range over a given period of time. This oscilator usually has two lines: "%K" that acts as a signal line; the other line is "%D" which is usually a 3-period moving average of %K

How is it calculated?

 
%K = (Current Close - Lowest Low)/(Highest High - Lowest Low) * 100
%D = 3-day SMA of %K

Lowest Low = lowest low for the look-back period
Highest High = highest high for the look-back period
%K is multiplied by 100 to move the decimal point two places

How to use it?

The theory behind this indicator is that in an upward-trending market, prices tend to close near their high, and during a downward-trending market, prices tend to close near their low. Transaction signals occur when the %K crosses through a three-period moving average called the "%D". 


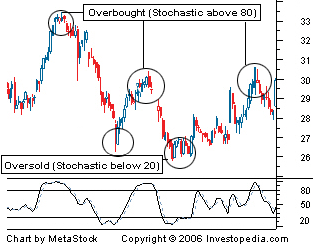
Just like the RSI, the stochastic oscilator can also be used to identify oversold and overbought market conditions.When the stochastic is above 80, it is considered to be overbought; when it is below 20, it is considered to be oversold.

Variants


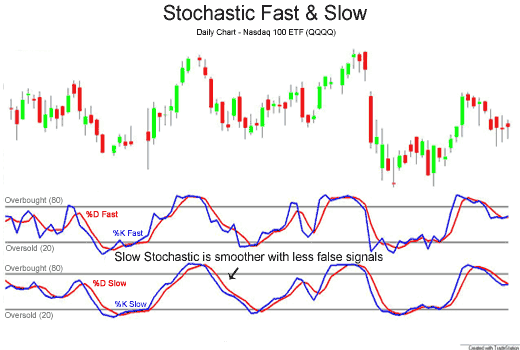
There are 2 main variants of the stochastic oscillator: The Fast & Slow Stochastic.
 
Fast Stochastic Oscillator: This is the basic formula explained above.
  • Fast %K = %K basic calculation
  • Fast %D = 3-period SMA of Fast %K
Slow Stochastic Oscillator: This form of the stochastic is used to further smooth both the %K and %D lines, reducing the number of false signals.
  • Slow %K = Fast %K smoothed with 3-period SMA
  • Slow %D = 3-period SMA of Slow %K

Comparisons and Contrasts with the RSI

While they are similar and also have similar goals, the way that each of these momentum indicators are calculated makes them better suited for different situations.

The RSI takes the last "n" periods and divides the gross positive changes per period by the gross negative changes. This means that the more often prices move higher in that "n" period span and the greater those changes become, the higher the RSI value.

A Stochastic is the measurement of the placement of a current price within a recent trading range. The theory is that as prices rise, closes tend to occur nearer to the high end of their recent range. When prices trend higher and closes begin to sag within the range it signals internal market weakness.

Simply stated, the Relative Strength Index yields the most meaningful results in trending markets while Stochastics work best in flat or choppy markets. The RSI, as mentioned, helps determine when a price has moved too far too fast. This implies a trending market. Stochastics help determine when a price has moved to the top or bottom of a trading range, which implies a non-trending (flat or choppy) market.


Share
Tweet
Pin
Share
No comentarios
Newer Posts
Older Posts

About me

Hello! I'm Ivan, a developing trader.
I've been studying how to trade the stock market for the past 3 years and I want to share the things that I've have learned.
Here you will find watchlists, info about technical analysis and also book & products reviews.
I hope that you find something useful.

Disclaimer: None of the information presented on this blog is a recommendation to buy or sell any financial instrument, this is only for educational purposes.

Popular Posts

    Candlesticks 5: Candlestick Pattern Dictionary Candlesticks 5: Candlestick Pattern Dictionary
    no image Weekend Sector Analysis for 01/16/2017
    Alternative Candles: Heikin Ashi Alternative Candles: Heikin Ashi
    Indicators: Accumulation/Distribution Indicators: Accumulation/Distribution
    Candlesticks 4: Bearish Reversal Patterns Candlesticks 4: Bearish Reversal Patterns
    Top Ten Lessons From: Reminiscences of a Stock Operator Top Ten Lessons From: Reminiscences of a Stock Operator
    A Seminar on Trading Psycology by Mark Douglas A Seminar on Trading Psycology by Mark Douglas
    Indicators: Stochastic Oscillator Indicators: Stochastic Oscillator
    Win a new trading PC! Win a new trading PC!
    Candlesticks 1: Introduction Candlesticks 1: Introduction

recent posts

Blog Archive

  • ▼  2017 (2)
    • ▼  January (2)
      • Weekend Sector Analysis for 01/16/2017
      • Midweek Sector Analysis 01/11/2016
  • ►  2016 (1)
    • ►  December (1)
  • ►  2015 (7)
    • ►  September (2)
    • ►  June (1)
    • ►  April (1)
    • ►  March (2)
    • ►  February (1)
  • ►  2014 (26)
    • ►  November (5)
    • ►  October (2)
    • ►  September (11)
    • ►  August (8)
Powered by Blogger.

Created with by ThemeXpose