­

Indicators: Accumulation/Distribution

2:50 PM / BY Zaytt
What is it? It's a momentum indicator that tracks the relationship between volume and price. It is often considered a leading indicator because it shows when a stock is being accumulated or distributed, foreshadowing major price moves. Again, volume precedes price. How is it calculated? The indicator has a three step calculation:   1. Money Flow Multiplier = [(close  -  low) - (high - close)] /(high - low)      2. Money Flow Volume =...

Continue Reading

Indicators: On Balance Volume (OBV)

2:03 PM / BY Zaytt
What is it? The On Balance Volume indicator or OBV, is an indicator that focuses on the importance of volume and how it can affect a give prince and asset's momentum. OBV is based on the idea tha volume precedes price, so if a security is seein an increasing OBV it is a signal that volume is increasing during the upward price moves; when it decreases, it means the opposite, volume is increasing on the...

Continue Reading

Indicators: Stochastic Oscillator

6:37 PM / BY Zaytt
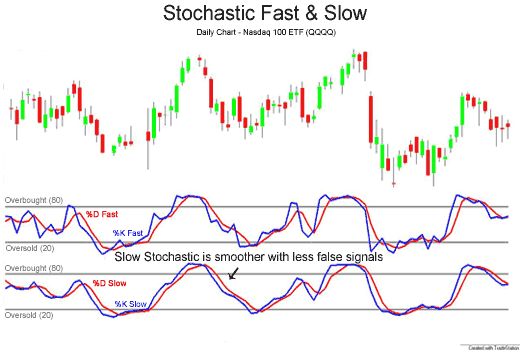
What is it? A stochastic oscillator is a momentum indicator that compares a scurity's closing price to its price range over a given period of time. This oscilator usually has two lines: "%K" that acts as a signal line; the other line is "%D" which is usually a 3-period moving average of %K How is it calculated?   %K = (Current Close - Lowest Low)/(Highest High - Lowest Low) * 100 %D = 3-day SMA...

Continue Reading

Indicators: Volume

12:08 PM / BY Zaytt
What is it? Volume is a very simple indicator but also a very powerful one if used correctly. It is a measure of how many shares of contracts of any given financial asset has been trader in a given period of time. How is it calculated? Volume is just a count for al the shares that were traded that day. If a buyer of a stock purchases 100 shares from a seller, then the volume...

Continue Reading

Indicators: The RSI

1:09 PM / BY Zaytt
What is it? The Relative Strenght Index or RSI is a momentum indicator that compares the magnitude of recent gains to recent losses in order to determine overbought and oversold conditions. How is it calculated? RSI = 100 - 100/(1 + RS*) *Where RS = Average of x days' up closes / Average of x days' down closes. How to use it: The RSI is an oscilator and as such, it has upper and lower...

Continue Reading